

Question: QUESTION A4 The following ANOVA table represents the estimates calculated by a researcher who wants to test for equality of mean waiting times in sixhospitals,

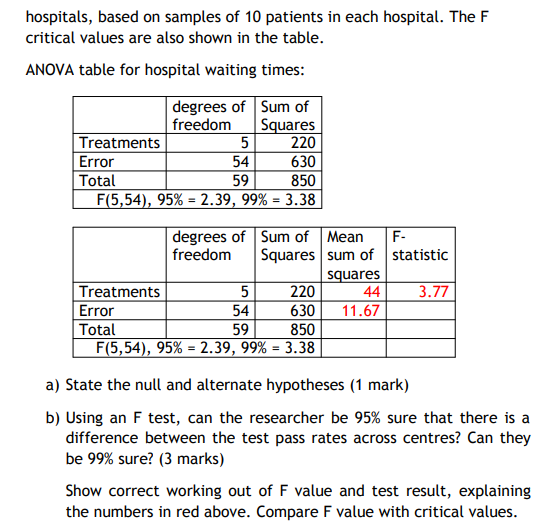

QUESTION A4 The following ANOVA table represents the estimates calculated by a researcher who wants to test for equality of mean waiting times in sixhospitals, based on samples of 10 patients in each hospital. The F critical values are also shown in the table. ANOVA table for hospital waiting times: degrees of Sum of degrees of Sum of Men freedom Squares sum of statistic .uares m_ -11 Total F 5 54 95% = 2.39 99%= 3. 11. 6? a) State the null and alternate hypotheses [1 mark] b) Using an F test, can the researcher be 95% sure that there is a difference between the test pass rates across centres? Can they be 99% sure? [3 marks) Show correct working out of F value and test result, explaining the numbers in red above. Compare F value with critical values
Step by Step Solution
There are 3 Steps involved in it

Get step-by-step solutions from verified subject matter experts