

Question: Question- According to above table please find and prepare comparative financial analysis among these banking companies . 4. The following data is the financial performance
Question- According to above table please find and prepare comparative financial analysis among these banking companies.
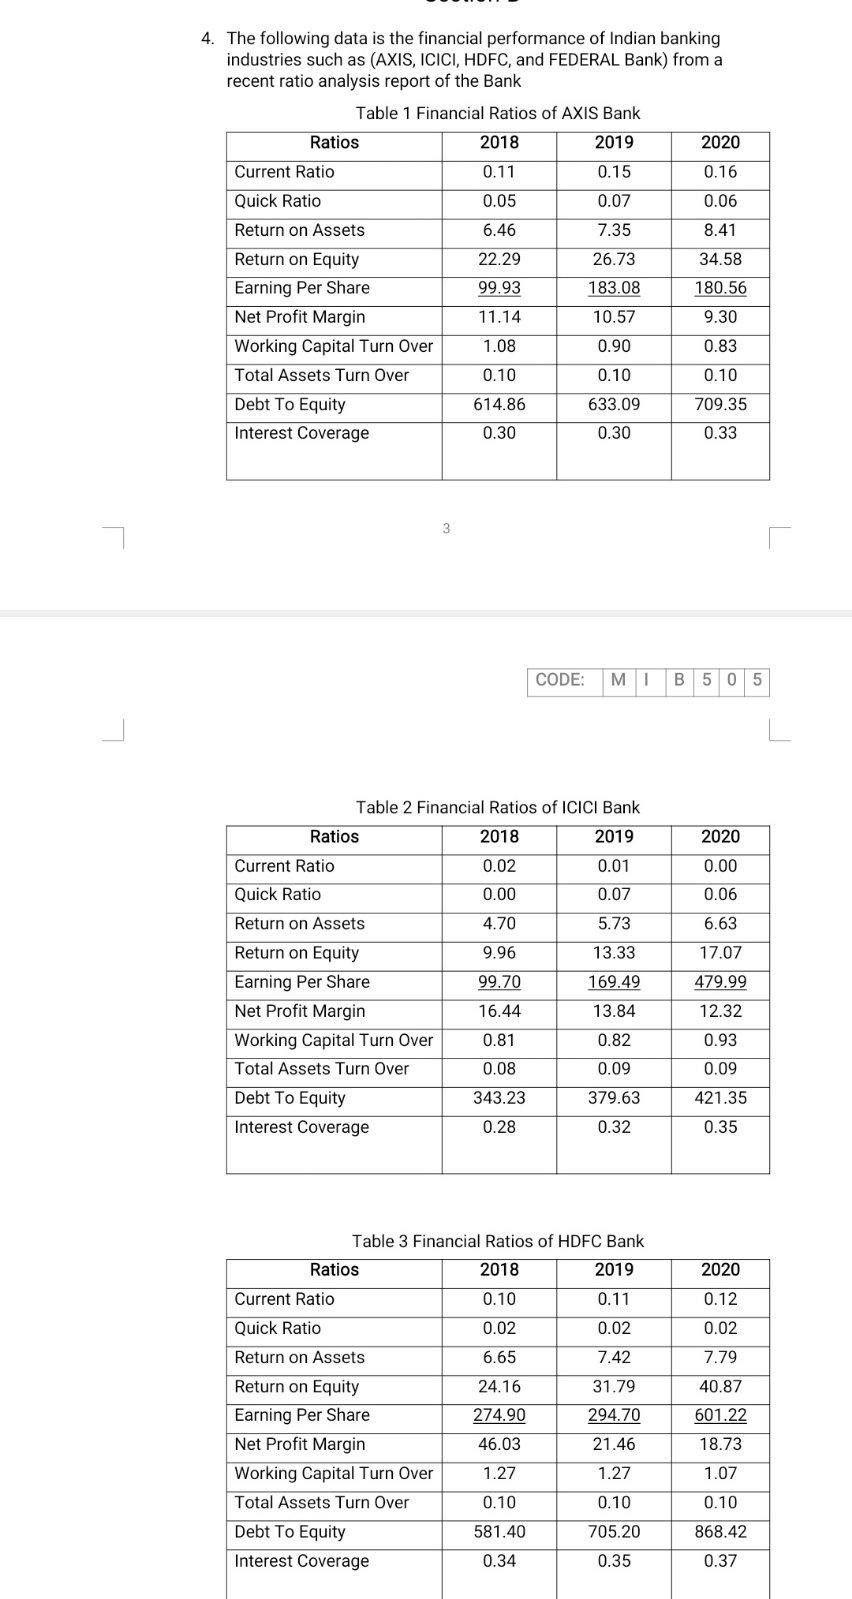
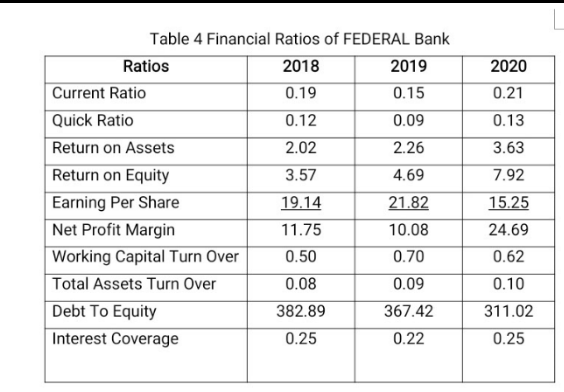
4. The following data is the financial performance of Indian banking industries such as (AXIS, ICICI, HDFC, and FEDERAL Bank) from a recent ratio analysis report of the Bank Table 1 Financial Ratios of AXIS Bank Ratios 2018 2019 2020 Current Ratio 0.11 0.15 0.16 Quick Ratio 0.05 0.07 0.06 6.46 8.41 7.35 26.73 22.29 99.93 11.14 34.58 180.56 183.08 10.57 9.30 Return on Assets Return on Equity Earning Per Share Net Profit Margin Working Capital Turn Over Total Assets Turn Over Debt To Equity Interest Coverage 1.08 0.90 0.83 0.10 0.10 0.10 614.86 633.09 709.35 0.30 0.30 0.33 3 CODE: M1 B 5 0 5 Table 2 Financial Ratios of ICICI Bank Ratios 2018 2019 2020 0.02 0.01 0.00 Current Ratio Quick Ratio 0.00 0.07 0.06 Return on Assets 4.70 5.73 6.63 13.33 17.07 9.96 99.70 169.49 479.99 16.44 13.84 12.32 Return on Equity Earning Per Share Net Profit Margin Working Capital Turn Over Total Assets Turn Over Debt To Equity Interest Coverage 0.81 0.82 0.93 0.08 0.09 0.09 343.23 379.63 421.35 0.28 0.32 0.35 Table 3 Financial Ratios of HDFC Bank Ratios 2018 2019 2020 Current Ratio 0.10 0.11 0.12 0.02 0.02 0.02 6.65 7.42 7.79 40.87 Quick Ratio Return on Assets Return on Equity Earning Per Share Net Profit Margin Working Capital Turn Over Total Assets Turn Over Debt To Equity Interest Coverage 601.22 24.16 274.90 46.03 1.27 31.79 294.70 21.46 18.73 1.27 1.07 0.10 0.10 0.10 705.20 581.40 0.34 868.42 0.37 0.35 2020 0.21 0.13 3.63 7.92 Table 4 Financial Ratios of FEDERAL Bank Ratios 2018 2019 Current Ratio 0.19 0.15 Quick Ratio 0.12 0.09 Return on Assets 2.02 2.26 Return on Equity 3.57 4.69 Earning Per Share 19.14 21.82 Net Profit Margin 11.75 10.08 Working Capital Turn Over 0.50 0.70 Total Assets Turn Over 0.08 0.09 Debt To Equity 382.89 367.42 Interest Coverage 0.25 0.22 15.25 24.69 0.62 0.10 311.02 0.25
Step by Step Solution
There are 3 Steps involved in it

Get step-by-step solutions from verified subject matter experts