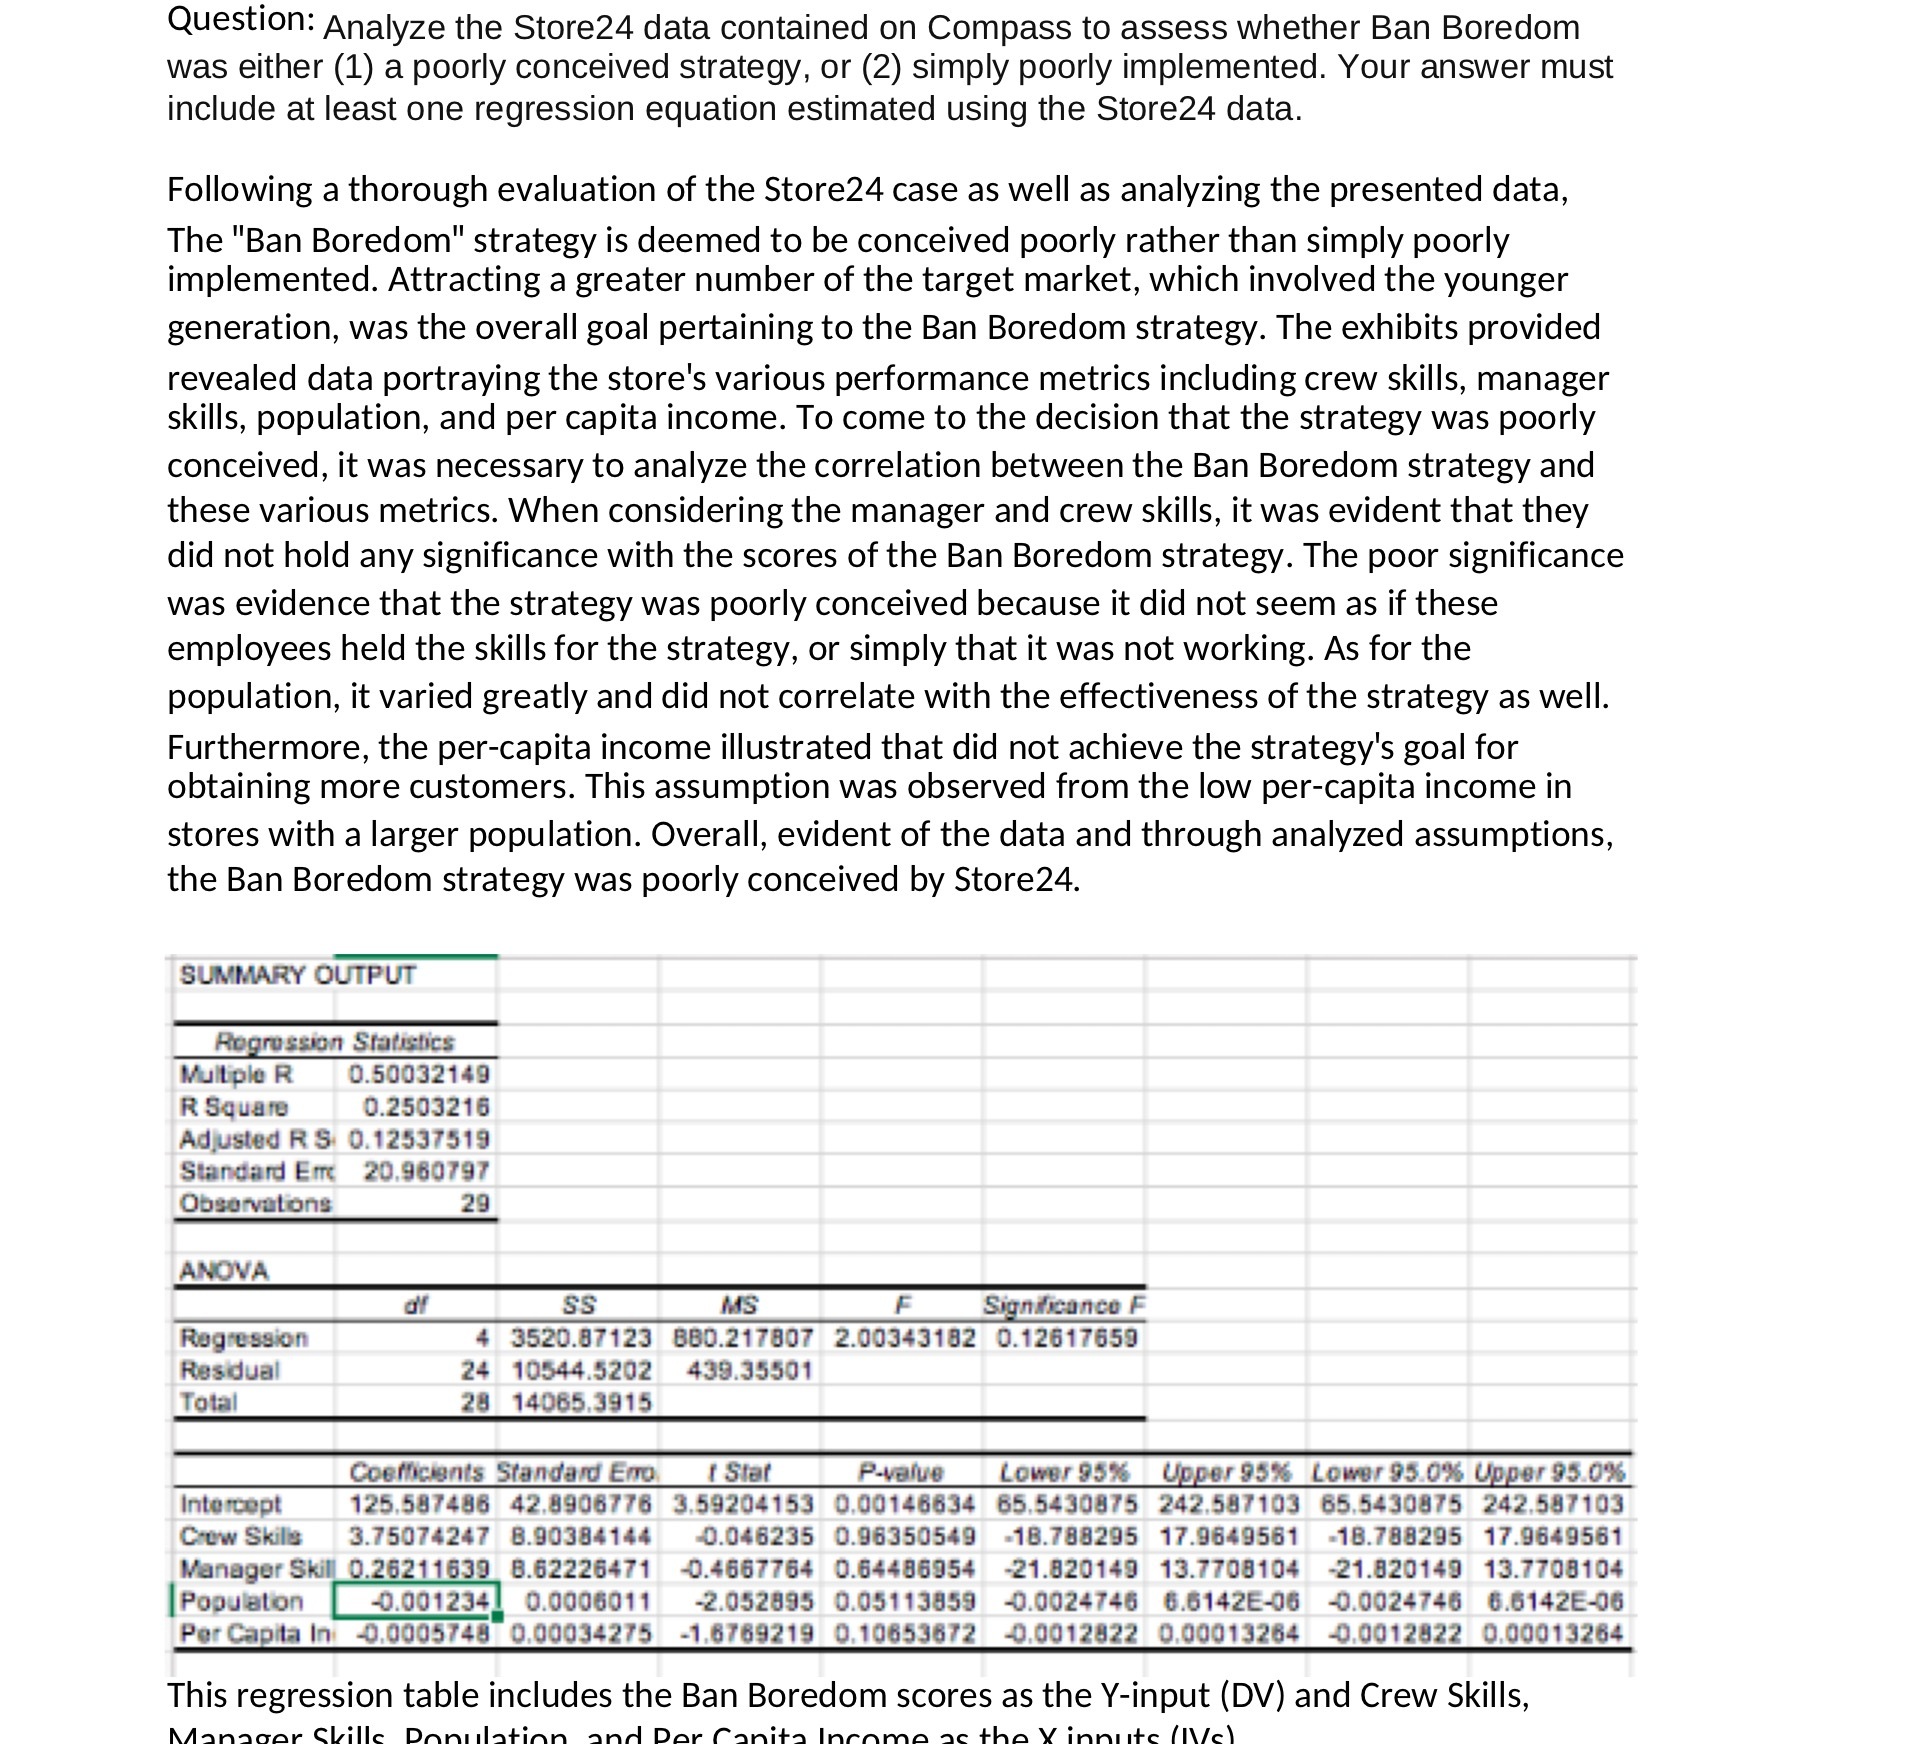
Question: Question: Analyze the Store24 data contained on Compass to assess whether Ban Boredom was either (1) a poorly conceived strategy, or (2) simply poorly implemented.

Question: Analyze the Store24 data contained on
Question: Analyze the Store24 data contained on Compass to assess whether Ban Boredom was either (1) a poorly conceived strategy, or (2) simply poorly implemented. Your answer must include at least one regression equation estimated using the Store24 data. Following a thorough evaluation of the Store24 case as well as analyzing the presented data, The "Ban Boredom" strategy is deemed to be conceived poorly rather than simply poorly implemented. Attracting a greater number of the target market, which involved the younger generation, was the overall goal pertaining to the Ban Boredom strategy. The exhibits provided revealed data portraying the store's various performance metrics including crew skills, manager skills, population, and per capita income. To come to the decision that the strategy was poorly conceived, it was necessary to analyze the correlation between the Ban Boredom strategy and these various metrics. When considering the manager and crew skills, it was evident that they did not hold any significance with the scores of the Ban Boredom strategy. The poor significance was evidence that the strategy was poorly conceived because it did not seem as if these employees held the skills for the strategy, or simply that it was not working. As for the population, it varied greatly and did not correlate with the effectiveness of the strategy as well. Furthermore, the per-capita income illustrated that did not achieve the strategy's goal for obtaining more customers. This assumption was observed from the low per-capita income in stores with a larger population. Overall, evident of the data and through analyzed assumptions, the Ban Boredom strategy was poorly conceived by Store24. SUMMARY OUTPUT Rogrossion Statistics Multiple R 0.50032149 R Square 0.2503216 Adjusted RS. 0.12537519 Standard Em 20.960797 Observations 29 ANOVA SS MS F Significance F Regression 4 3520.87123 880.217807 2.00343182 0.12617659 Residual 24 10544.5202 439.35501 Total 28 14065.3915 Coefficients Standard Ero I Star P-value Lower 95% Upper 95% Lower 95.0% Upper 95.0% Intercept 125.587486 42.8906776 3.59204153 0.00146634 65.5430875 242.587103 65.5430875 242.587103 Crow Skills 3.75074247 8.90384144 -0.046235 0.96350549 -18.788295 17.9649561 -18.788295 17.9649561 Manager Skill 0.26211639 8.62226471 -0.4667764 0.64486954 -21.820149 13.7708104 -21.820149 13.7708104 Population -0.001234 0.0006011 -2.052895 0.05113859 -0.0024746 6.6142E-06 -0.0024746 6.6142E-06 Per Capita In -0.0005748 0.00034275 -1.6769219 0.10653672 -0.0012822 0.00013264 -0.0012822 0.00013264 This regression table includes the Ban Boredom scores as the Y-input (DV) and Crew Skills

Step by Step Solution

There are 3 Steps involved in it

1 Expert Approved Answer
Step: 1 Unlock blur-text-image
Question Has Been Solved by an Expert!

Get step-by-step solutions from verified subject matter experts

Step: 2 Unlock
Step: 3 Unlock

Students Have Also Explored These Related Accounting Questions!