

Question: question attached 7. In the Spreadsheet assignment we asked you to use a spreadsheet to calculate the following summary statistics concerning average temperature in central
question attached
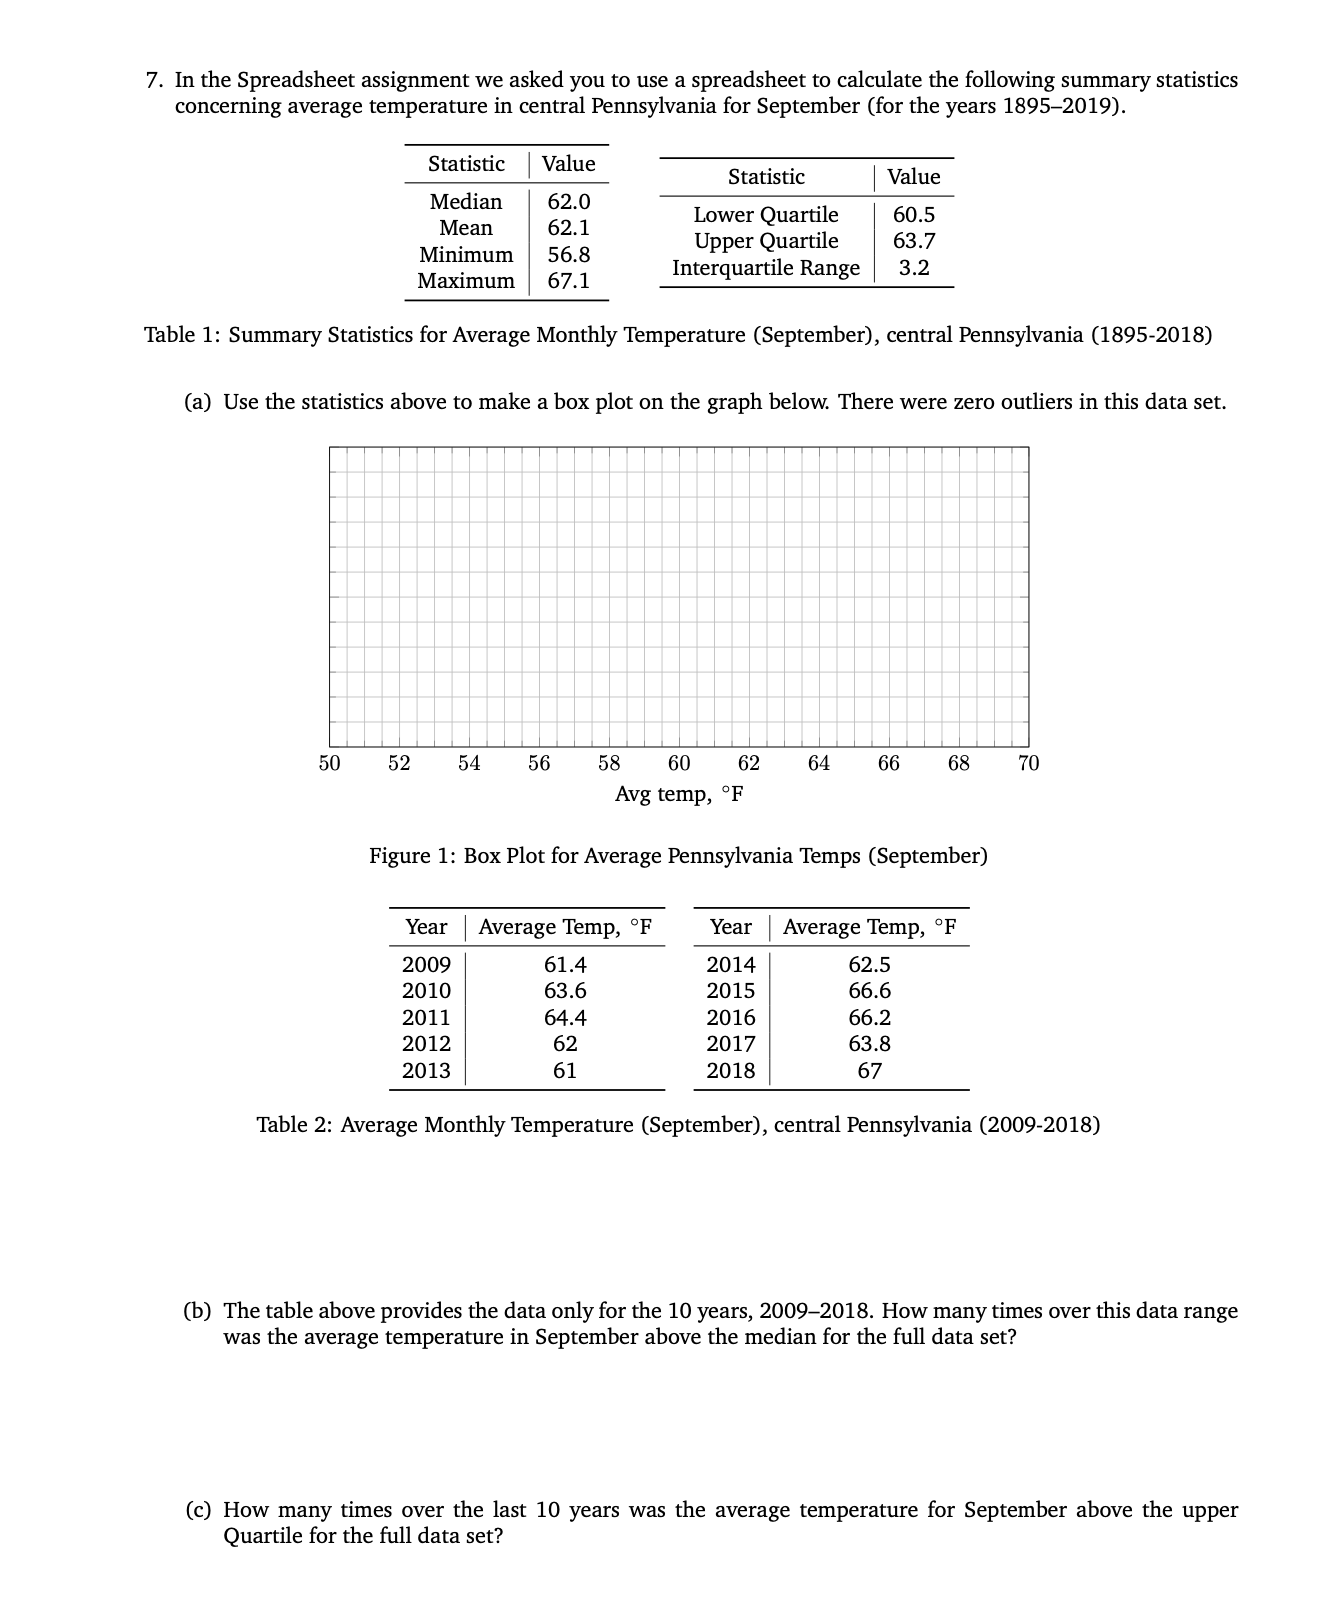
7. In the Spreadsheet assignment we asked you to use a spreadsheet to calculate the following summary statistics concerning average temperature in central Pennsylvania for September (for the years 18952019). Statistic | Value Median 62.0 Mean 62. 1 Minimum 56.8 Maximum 67. 1 Statistic | Value Lower Quartile 60.5 Upper Quartile 63.7 Interquartile Range 3.2 Table 1: Summary Statistics for Average Monthly Temperature (September), central Pennsylvania (1895-2018) (3) Use the statistics above to make a box plot on the graph below. There were zero outliers in this data set. 50 52 54 56 58 60 62 64 66 68 Avg temp, \"F Figure 1: Box Plot for Average Pennsylvania Temps (September) Year | Average Temp, F Year | Average Temp, ClF 2009 61.4 2014 62.5 2010 63.6 2015 66.6 2011 64.4 2016 66.2 2012 62 2017 63.8 2013 61 2018 67 Table 2: Average Monthly Temperature (September), central Pennsylvania (2009-2018) (b) The table above provides the data only for the 10 years, 20092018. How many times over this data range was the average temperature in September above the median for the full data set? (c) How many times over the last 10 years was the average temperature for September above the upper Quartile for the full data set
Step by Step Solution
There are 3 Steps involved in it

Get step-by-step solutions from verified subject matter experts