

Question: QUESTION: Based on the analysis in these three pictures, make recommendations about the production processes and pricing of Orchid Relief. (Preferably a full paragraph). Thank
QUESTION: Based on the analysis in these three pictures, make recommendations about the production processes and pricing of Orchid Relief. (Preferably a full paragraph). Thank you!
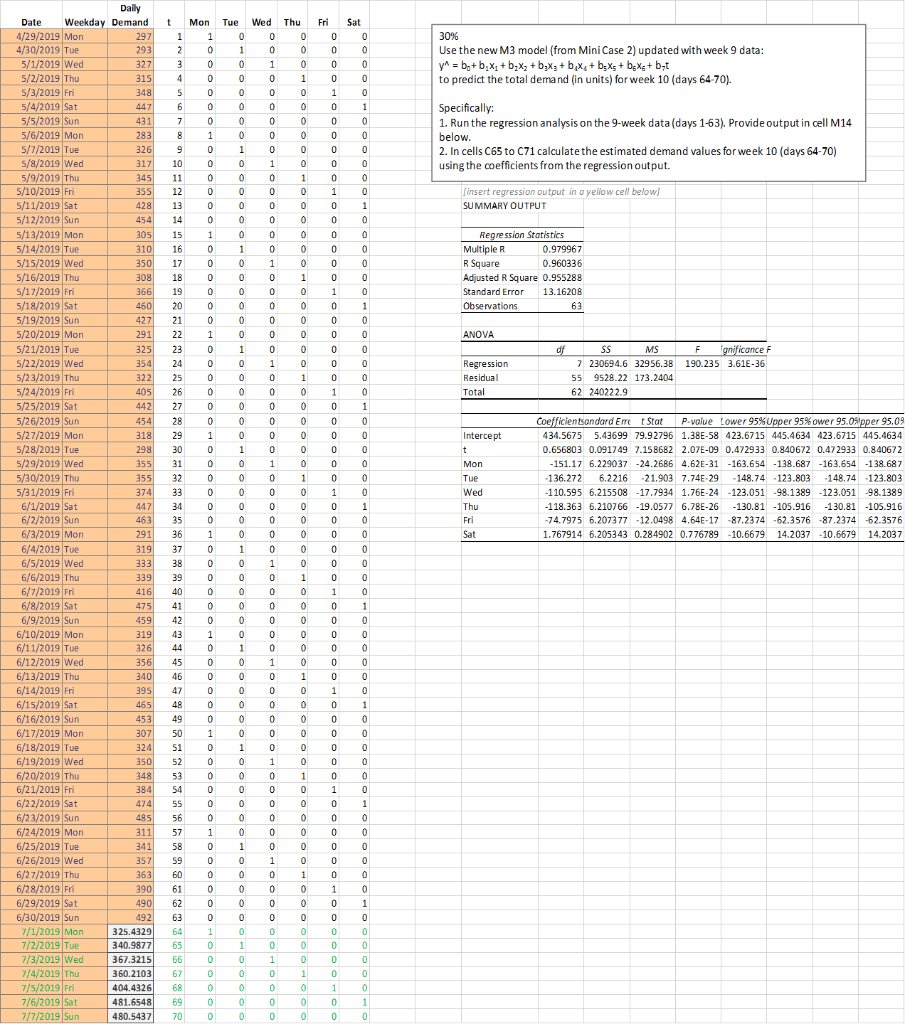
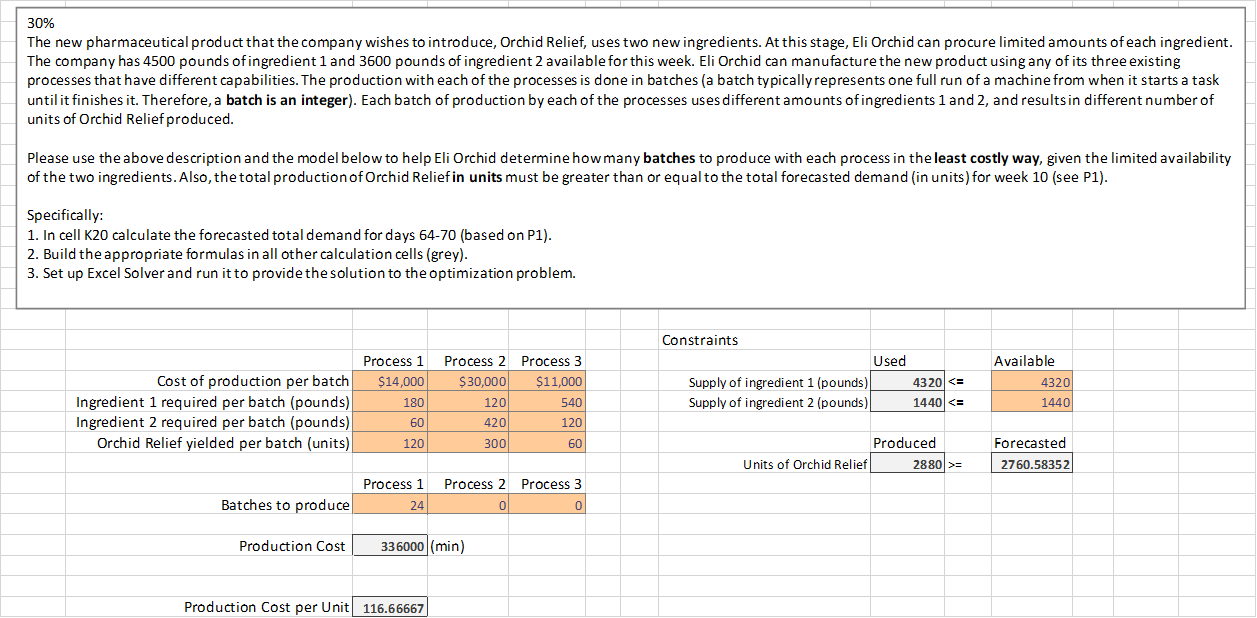
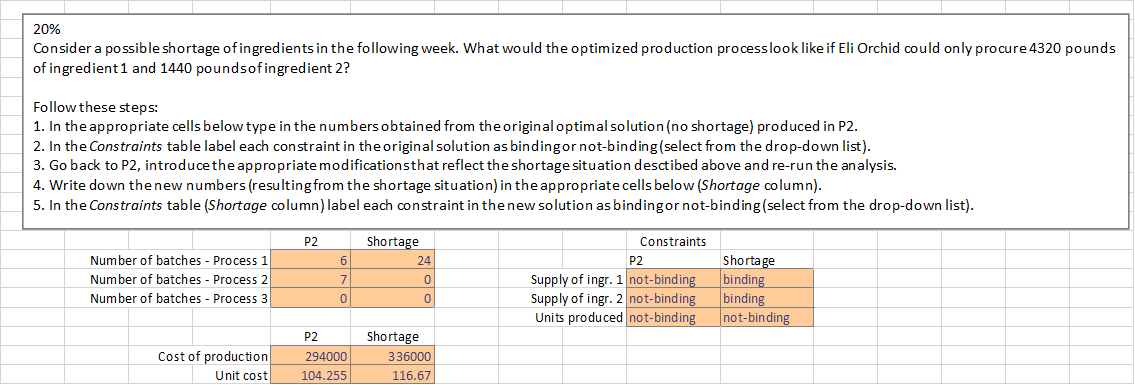
t 297 1 2 3 4 5 6 7 8 9 30% Use the new M3 model (from Mini Case 2) updated with week 9 data: y^ = b + b.X: +b,Xz+b3X3 + b x + bxs + beXs+byt to predict the total demand (in units) for week 10 (days 64-70). Specifically 1. Run the regression analysis on the 9-week data (days 1-63). Provide output in cell M14 below. 2. In cells C65 to C71 calculate the estimated demand values for week 10 (days 64-70) using the coefficients from the regression output. 10 insert regression output in a yellow cell below) SUMMARY OUTPUT 11 12 13 14 15 16 17 18 19 20 21 22 23 24 25 26 Regression Statistics Multiple R 0.979967 R Square 0.960336 Adjusted R Square 0.955288 Standard Error 13.16208 Observations 63 ANOVA Regression Residual Total df SS MS F ignificance F 7 230694.6 32956.38 190.235 3.61E-36 55 9528.22 173.2404 62 240222.9 27 28 29 30 31 32 Intercept t Mon Dailly Date Weekday Demand 4/29/2019 Mon 4/30/2019 Tue 293 5/1/2019 Wed 327 5/2/2013 Thu 315 5/3/2019 Fri 348 5/4/2019 Sat 447 5/5/2019 Sun 431 5/6/2019 Mon 283 5/7/2019 Tue 326 5/8/2019 Wed 317 5/9/2019 Thu 345 5/10/2019 Fri 355 5/11/2019 Sat 428 5/12/2019 Sun 454 5/13/2019 Mon 305 5/14/2019 Tue 310 5/15/2019 Wed 350 5/16/2019 Thu 308 5/17/2019 Fri 366 5/18/2019 Sat 460 5/19/2019 Sun 427 5/20/2019 Mon 291 5/21/2019 Tue 325 5/22/2019 Wed 354 5/23/2019 Thu 322 5/24/2019 Fri 405 5/25/2019 Sat 442 5/26/2019 Sun 454 5/27/2019 Mon 318 5/28/2019 Tue 298 5/29/2019 Wed 355 5/10/2019 Thu 355 5/31/2019 Fri 374 6/1/2019 Sat 447 6/2/2019 Sun 463 6/3/2019 Mon 291 6/4/2019 Tue 319 6/5/2019 Wed 333 6/6/2019 Thu 339 6/7/2019 Fri 416 6/8/2019 Sat 475 6/9/2019 Sun 459 6/10/2019 Mon 319 6/11/2019 Tue 326 6/12/2019 Wed 356 6/13/2018 Thu 340 6/14/2019 Fri 395 6/15/2019 Sat 465 6/16/2019 Sun 453 6/17/2019 Mon 307 6/18/2019 Tue 324 6/19/2019 Wed 350 6/20/2019 Thu 348 6/21/2019 Fri 384 6/22/2019 Sat 474 6/23/2019 Sun 485 6/24/2019 Mon 311 6/25/2019 Tue 341 6/26/2019 Wed 357 6/27/2 019 Thu 363 6/28/2019 Fri 390 6/29/2019 Sat 490 6/30/2019 Sun 492 7/1/2019 Mon 325.4329 7/2/2019 Tue 340.9877 7/3/2019 Wed 367.3215 7/4/2019 Thu 360.2103 7/5/2019 Fri 404,4326 7/6/2019 Sat 481.6548 7/7/2019 Sun 480.5437 Mon Tue Wed Thu Fri Sat 1 0 0 0 0 0 0 1 0 0 0 0 0 0 0 1 0 0 0 0 0 0 1 0 0 0 0 0 0 1 0 0 0 0 0 0 1 0 0 0 0 0 0 1 1 0 0 0 0 0 0 1 0 0 0 0 0 0 1 0 0 a 0 0 0 0 1 0 0 0 0 0 0 1 0 0 0 0 0 0 1 0 0 0 0 0 0 1 0 0 0 0 0 0 1 0 0 0 0 0 0 1 0 0 0 0 0 0 1 0 0 0 0 0 0 1 0 a 0 0 0 0 0 1 1 0 0 0 0 0 0 1 0 0 0 0 0 0 1 0 0 0 0 0 0 1 0 0 0 0 0 0 1 0 0 0 0 0 0 1 0 0 0 0 0 0 1 0 0 0 0 0 0 1 0 0 0 0 0 0 0 1 1 0 0 0 0 0 0 1 0 0 0 0 0 0 1 0 0 0 0 0 0 0 1 0 0 0 0 0 0 1 0 0 0 0 0 0 1 1 0 0 0 0 0 0 0 1 0 0 0 0 0 0 1 0 0 0 0 0 0 1 0 0 0 0 0 1 0 a 0 0 0 0 0 1 0 0 0 0 0 0 1 0 0 0 0 0 0 1 0 0 0 0 0 0 0 1 0 0 0 0 0 0 0 1 0 0 0 0 0 0 0 1 0 0 0 0 0 0 1 0 0 0 0 0 0 0 1 0 0 0 0 0 0 0 1 0 0 0 0 0 0 0 1 0 0 0 0 0 0 1 0 0 0 0 0 0 1 0 0 0 0 0 0 0 1 0 0 0 0 0 0 1 0 0 0 0 0 0 1 0 0 0 0 0 0 1 0 0 0 0 0 0 1 0 0 0 0 0 0 0 1 0 0 0 0 0 0 0 1 0 0 0 0 0 0 1 0 0 0 0 0 0 0 1 0 0 0 0 0 0 1 0 0 0 0 0 0 0 0 1 0 0 0 0 0 0 0 1 0 0 0 0 0 0 0 1 1 0 0 0 0 0 0 34 35 Coefficientsandard Erre Stat P-value Lower 95% Upper 95%ower 95.0 pper 95.09 434.5675 5.43699 79.92796 1.38E-58 423.6715 445.4634 423.6715 445.4634 0.656803 0.091749 7.15 8682 2.07E-09 0.472933 0.840672 0.472933 0.840672 -151.17 6.229037 -24.2686 4.62E-31 -163.654 -138.687 -163.654 -138.687 -136.272 6.2216 -21.903 7.74E-29 -148.74 -123.803 -148.74 -123.803 -110.595 6.215508 -17.7934 1.76E-24 -123.051 -98.1389 -123.051 -98.1389 -118.363 6.210766 -19.0577 6.78E-26 -130.81 -105.916 -130.81 -105.916 -74.7975 6.207377 -12.0498 4.64E-17 -87.2374 -62.3576 -87.2374 -62.3576 1.767914 6.205343 0.284902 0.776789 -10.6679 14.2037 -10.6679 14.2037 Tue Wed Thu Fri Sat 37 38 39 40 41 42 43 44 45 46 47 48 49 50 51 52 53 54 55 56 57 58 59 60 61 62 63 64 65 66 67 68 69 70 30% The new pharmaceutical product that the company wishes to introduce, Orchid Relief, uses two new ingredients. At this stage, Eli Orchid can procure limited amounts of each ingredient. The company has 4500 pounds of ingredient 1 and 3600 pounds of ingredient 2 available for this week. Eli Orchid can manufacture the new product using any of its three existing processes that have different capabilities. The production with each of the processes is done in batches (a batch typically represents one full run of a machine from when it starts a task until it finishes it. Therefore, a batch is an integer). Each batch of production by each of the processes uses different amounts of ingredients 1 and 2, and results in different number of units of Orchid Relief produced. Please use the above description and the model below to help Eli Orchid determine how many batches to produce with each process in the least costly way, given the limited availability of the two ingredients. Also, the total production of Orchid Reliefin units must be greater than or equal to the total forecasted demand (in units) for week 10 (see P1). Specifically: 1. In cell K20 calculate the forecasted total demand for days 64-70 (based on P1). 2. Build the appropriate formulas in all other calculation cells (grey). 3. Set up Excel Solver and run it to provide the solution to the optimization problem. Process 1 $14,000 180 Process 2 Process 3 $30,000 $11,000 120 540 420 120 300 60 Cost of production per batch Ingredient 1 required per batch (pounds) Ingredient 2 required per batch (pounds) Orchid Relief yielded per batch (units) Constraints Used Supply of ingredient 1 (pounds) 43201 = Forecasted 2760.58352 Process 1 24 Process 2 Process 3 0 0 Batches to produce Production Cost 336000 (min) Production Cost per Unit 116.66667 20% Consider a possible shortage of ingredients in the following week. What would the optimized production processlook like if Eli Orchid could only procure 4320 pounds of ingredient1 and 1440 poundsofingredient 2? Follow these steps: 1. In the appropriate cells below type in the numbers obtained from the original optimal solution (no shortage) produced in P2. 2. In the Constraints table label each constraint in the original solution as bindingor not-binding(select from the drop-down list). 3. Go back to P2, introduce the appropriate modificationsthat reflect the shortage situation desctibed above and re-run the analysis. 4. Write down the new numbers (resulting from the shortage situation) in the appropriate cells below (Shortage column). 5. In the Constraints table (Shortage column) label each constraint in the new solution as bindingor not-binding(select from the drop-down list). P2 6 Number of batches - Process 1 Number of batches - Process 2 Number of batches - Process 3 Shortage 24 0 0 7 0 Constraints P2 Supply of ingr. 1 not-binding Supply of ingr. 2 not-binding Units produced not-binding Shortage binding binding not-binding Cost of production Unit cost P2 294000 104.255 Shortage 336000 116.67 t 297 1 2 3 4 5 6 7 8 9 30% Use the new M3 model (from Mini Case 2) updated with week 9 data: y^ = b + b.X: +b,Xz+b3X3 + b x + bxs + beXs+byt to predict the total demand (in units) for week 10 (days 64-70). Specifically 1. Run the regression analysis on the 9-week data (days 1-63). Provide output in cell M14 below. 2. In cells C65 to C71 calculate the estimated demand values for week 10 (days 64-70) using the coefficients from the regression output. 10 insert regression output in a yellow cell below) SUMMARY OUTPUT 11 12 13 14 15 16 17 18 19 20 21 22 23 24 25 26 Regression Statistics Multiple R 0.979967 R Square 0.960336 Adjusted R Square 0.955288 Standard Error 13.16208 Observations 63 ANOVA Regression Residual Total df SS MS F ignificance F 7 230694.6 32956.38 190.235 3.61E-36 55 9528.22 173.2404 62 240222.9 27 28 29 30 31 32 Intercept t Mon Dailly Date Weekday Demand 4/29/2019 Mon 4/30/2019 Tue 293 5/1/2019 Wed 327 5/2/2013 Thu 315 5/3/2019 Fri 348 5/4/2019 Sat 447 5/5/2019 Sun 431 5/6/2019 Mon 283 5/7/2019 Tue 326 5/8/2019 Wed 317 5/9/2019 Thu 345 5/10/2019 Fri 355 5/11/2019 Sat 428 5/12/2019 Sun 454 5/13/2019 Mon 305 5/14/2019 Tue 310 5/15/2019 Wed 350 5/16/2019 Thu 308 5/17/2019 Fri 366 5/18/2019 Sat 460 5/19/2019 Sun 427 5/20/2019 Mon 291 5/21/2019 Tue 325 5/22/2019 Wed 354 5/23/2019 Thu 322 5/24/2019 Fri 405 5/25/2019 Sat 442 5/26/2019 Sun 454 5/27/2019 Mon 318 5/28/2019 Tue 298 5/29/2019 Wed 355 5/10/2019 Thu 355 5/31/2019 Fri 374 6/1/2019 Sat 447 6/2/2019 Sun 463 6/3/2019 Mon 291 6/4/2019 Tue 319 6/5/2019 Wed 333 6/6/2019 Thu 339 6/7/2019 Fri 416 6/8/2019 Sat 475 6/9/2019 Sun 459 6/10/2019 Mon 319 6/11/2019 Tue 326 6/12/2019 Wed 356 6/13/2018 Thu 340 6/14/2019 Fri 395 6/15/2019 Sat 465 6/16/2019 Sun 453 6/17/2019 Mon 307 6/18/2019 Tue 324 6/19/2019 Wed 350 6/20/2019 Thu 348 6/21/2019 Fri 384 6/22/2019 Sat 474 6/23/2019 Sun 485 6/24/2019 Mon 311 6/25/2019 Tue 341 6/26/2019 Wed 357 6/27/2 019 Thu 363 6/28/2019 Fri 390 6/29/2019 Sat 490 6/30/2019 Sun 492 7/1/2019 Mon 325.4329 7/2/2019 Tue 340.9877 7/3/2019 Wed 367.3215 7/4/2019 Thu 360.2103 7/5/2019 Fri 404,4326 7/6/2019 Sat 481.6548 7/7/2019 Sun 480.5437 Mon Tue Wed Thu Fri Sat 1 0 0 0 0 0 0 1 0 0 0 0 0 0 0 1 0 0 0 0 0 0 1 0 0 0 0 0 0 1 0 0 0 0 0 0 1 0 0 0 0 0 0 1 1 0 0 0 0 0 0 1 0 0 0 0 0 0 1 0 0 a 0 0 0 0 1 0 0 0 0 0 0 1 0 0 0 0 0 0 1 0 0 0 0 0 0 1 0 0 0 0 0 0 1 0 0 0 0 0 0 1 0 0 0 0 0 0 1 0 0 0 0 0 0 1 0 a 0 0 0 0 0 1 1 0 0 0 0 0 0 1 0 0 0 0 0 0 1 0 0 0 0 0 0 1 0 0 0 0 0 0 1 0 0 0 0 0 0 1 0 0 0 0 0 0 1 0 0 0 0 0 0 1 0 0 0 0 0 0 0 1 1 0 0 0 0 0 0 1 0 0 0 0 0 0 1 0 0 0 0 0 0 0 1 0 0 0 0 0 0 1 0 0 0 0 0 0 1 1 0 0 0 0 0 0 0 1 0 0 0 0 0 0 1 0 0 0 0 0 0 1 0 0 0 0 0 1 0 a 0 0 0 0 0 1 0 0 0 0 0 0 1 0 0 0 0 0 0 1 0 0 0 0 0 0 0 1 0 0 0 0 0 0 0 1 0 0 0 0 0 0 0 1 0 0 0 0 0 0 1 0 0 0 0 0 0 0 1 0 0 0 0 0 0 0 1 0 0 0 0 0 0 0 1 0 0 0 0 0 0 1 0 0 0 0 0 0 1 0 0 0 0 0 0 0 1 0 0 0 0 0 0 1 0 0 0 0 0 0 1 0 0 0 0 0 0 1 0 0 0 0 0 0 1 0 0 0 0 0 0 0 1 0 0 0 0 0 0 0 1 0 0 0 0 0 0 1 0 0 0 0 0 0 0 1 0 0 0 0 0 0 1 0 0 0 0 0 0 0 0 1 0 0 0 0 0 0 0 1 0 0 0 0 0 0 0 1 1 0 0 0 0 0 0 34 35 Coefficientsandard Erre Stat P-value Lower 95% Upper 95%ower 95.0 pper 95.09 434.5675 5.43699 79.92796 1.38E-58 423.6715 445.4634 423.6715 445.4634 0.656803 0.091749 7.15 8682 2.07E-09 0.472933 0.840672 0.472933 0.840672 -151.17 6.229037 -24.2686 4.62E-31 -163.654 -138.687 -163.654 -138.687 -136.272 6.2216 -21.903 7.74E-29 -148.74 -123.803 -148.74 -123.803 -110.595 6.215508 -17.7934 1.76E-24 -123.051 -98.1389 -123.051 -98.1389 -118.363 6.210766 -19.0577 6.78E-26 -130.81 -105.916 -130.81 -105.916 -74.7975 6.207377 -12.0498 4.64E-17 -87.2374 -62.3576 -87.2374 -62.3576 1.767914 6.205343 0.284902 0.776789 -10.6679 14.2037 -10.6679 14.2037 Tue Wed Thu Fri Sat 37 38 39 40 41 42 43 44 45 46 47 48 49 50 51 52 53 54 55 56 57 58 59 60 61 62 63 64 65 66 67 68 69 70 30% The new pharmaceutical product that the company wishes to introduce, Orchid Relief, uses two new ingredients. At this stage, Eli Orchid can procure limited amounts of each ingredient. The company has 4500 pounds of ingredient 1 and 3600 pounds of ingredient 2 available for this week. Eli Orchid can manufacture the new product using any of its three existing processes that have different capabilities. The production with each of the processes is done in batches (a batch typically represents one full run of a machine from when it starts a task until it finishes it. Therefore, a batch is an integer). Each batch of production by each of the processes uses different amounts of ingredients 1 and 2, and results in different number of units of Orchid Relief produced. Please use the above description and the model below to help Eli Orchid determine how many batches to produce with each process in the least costly way, given the limited availability of the two ingredients. Also, the total production of Orchid Reliefin units must be greater than or equal to the total forecasted demand (in units) for week 10 (see P1). Specifically: 1. In cell K20 calculate the forecasted total demand for days 64-70 (based on P1). 2. Build the appropriate formulas in all other calculation cells (grey). 3. Set up Excel Solver and run it to provide the solution to the optimization problem. Process 1 $14,000 180 Process 2 Process 3 $30,000 $11,000 120 540 420 120 300 60 Cost of production per batch Ingredient 1 required per batch (pounds) Ingredient 2 required per batch (pounds) Orchid Relief yielded per batch (units) Constraints Used Supply of ingredient 1 (pounds) 43201 = Forecasted 2760.58352 Process 1 24 Process 2 Process 3 0 0 Batches to produce Production Cost 336000 (min) Production Cost per Unit 116.66667 20% Consider a possible shortage of ingredients in the following week. What would the optimized production processlook like if Eli Orchid could only procure 4320 pounds of ingredient1 and 1440 poundsofingredient 2? Follow these steps: 1. In the appropriate cells below type in the numbers obtained from the original optimal solution (no shortage) produced in P2. 2. In the Constraints table label each constraint in the original solution as bindingor not-binding(select from the drop-down list). 3. Go back to P2, introduce the appropriate modificationsthat reflect the shortage situation desctibed above and re-run the analysis. 4. Write down the new numbers (resulting from the shortage situation) in the appropriate cells below (Shortage column). 5. In the Constraints table (Shortage column) label each constraint in the new solution as bindingor not-binding(select from the drop-down list). P2 6 Number of batches - Process 1 Number of batches - Process 2 Number of batches - Process 3 Shortage 24 0 0 7 0 Constraints P2 Supply of ingr. 1 not-binding Supply of ingr. 2 not-binding Units produced not-binding Shortage binding binding not-binding Cost of production Unit cost P2 294000 104.255 Shortage 336000 116.67Step by Step Solution
There are 3 Steps involved in it
1 Expert Approved Answer
Step: 1 Unlock

Question Has Been Solved by an Expert!
Get step-by-step solutions from verified subject matter experts
Step: 2 Unlock
Step: 3 Unlock