

Question: Question Based on the relationships in the Income statement and Statement of Financial Position, determine the missing figures for each of the 3 companies AMT
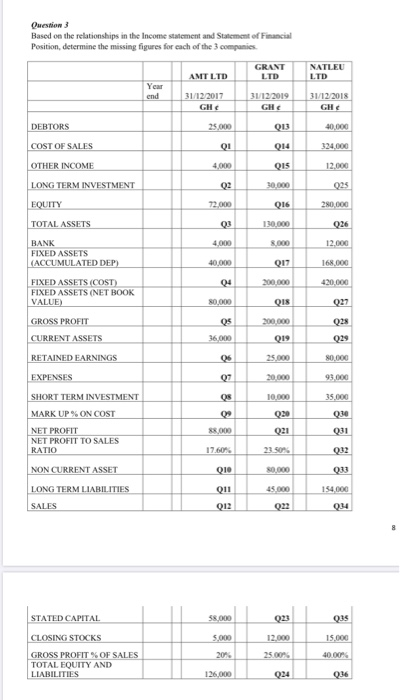
Question Based on the relationships in the Income statement and Statement of Financial Position, determine the missing figures for each of the 3 companies AMT LTD GRANT LTD NATLEU LTD Year end 31/12/2017 GH 31/12/2019 31/12/2018 GH DEBTORS 25.000 Q13 40.000 COST OF SALES 01 014 324,000 OTHER INCOME 4,000 QIS 12.000 LONG TERM INVESTMENT 02 30.000 023 EQUITY Q16 280,000 TOTAL ASSETS Q3 130.000 026 12.000 BANK FIXED ASSETS (ACCUMULATED DEP) 40.000 017 168,000 04 420.000 80.000 QIS 027 FIXED ASSETS (COST) FIXED ASSETS (NET BOOK VALUE) GROSS PROFIT CURRENT ASSETS Q5 36.000 200.000 Q19 Q25 029 RETAINED EARNINGS Os 25.000 80.000 EXPENSES Q7 93.000 os 10.000 35.000 09 020 SHORT TERM INVESTMENT MARK UP% ON COST NET PROFIT NET PROFIT TO SALES RATIO 030 021 021 17.60 23 50 032 NON CURRENT ASSET Q10 033 154.000 LONG TERM LIABILITIES Q11 45.000 SALES 012 022 034 STATED CAPITAL 58.000 Q23 035 CLOSING STOCKS 5.000 12.000 15.000 20% 25.00 40.00 GROSS PROFIT % OF SALES TOTAL EQUITY AND LIABILITIES 126.000 Q24 0:36 Question Based on the relationships in the Income statement and Statement of Financial Position, determine the missing figures for each of the 3 companies AMT LTD GRANT LTD NATLEU LTD Year end 31/12/2017 GH 31/12/2019 31/12/2018 GH DEBTORS 25.000 Q13 40.000 COST OF SALES 01 014 324,000 OTHER INCOME 4,000 QIS 12.000 LONG TERM INVESTMENT 02 30.000 023 EQUITY Q16 280,000 TOTAL ASSETS Q3 130.000 026 12.000 BANK FIXED ASSETS (ACCUMULATED DEP) 40.000 017 168,000 04 420.000 80.000 QIS 027 FIXED ASSETS (COST) FIXED ASSETS (NET BOOK VALUE) GROSS PROFIT CURRENT ASSETS Q5 36.000 200.000 Q19 Q25 029 RETAINED EARNINGS Os 25.000 80.000 EXPENSES Q7 93.000 os 10.000 35.000 09 020 SHORT TERM INVESTMENT MARK UP% ON COST NET PROFIT NET PROFIT TO SALES RATIO 030 021 021 17.60 23 50 032 NON CURRENT ASSET Q10 033 154.000 LONG TERM LIABILITIES Q11 45.000 SALES 012 022 034 STATED CAPITAL 58.000 Q23 035 CLOSING STOCKS 5.000 12.000 15.000 20% 25.00 40.00 GROSS PROFIT % OF SALES TOTAL EQUITY AND LIABILITIES 126.000 Q24 0:36
Step by Step Solution
There are 3 Steps involved in it

Get step-by-step solutions from verified subject matter experts