

Question: Question below please. I'm thinking about it to hard. Thanks 3.3: Correlation and coefficient of determinat. zyBooks catalog ? Help/FAQ Luis Ins CHALLENGE ACTIVITY 3.3.2:
Question below please. I'm thinking about it to hard. Thanks
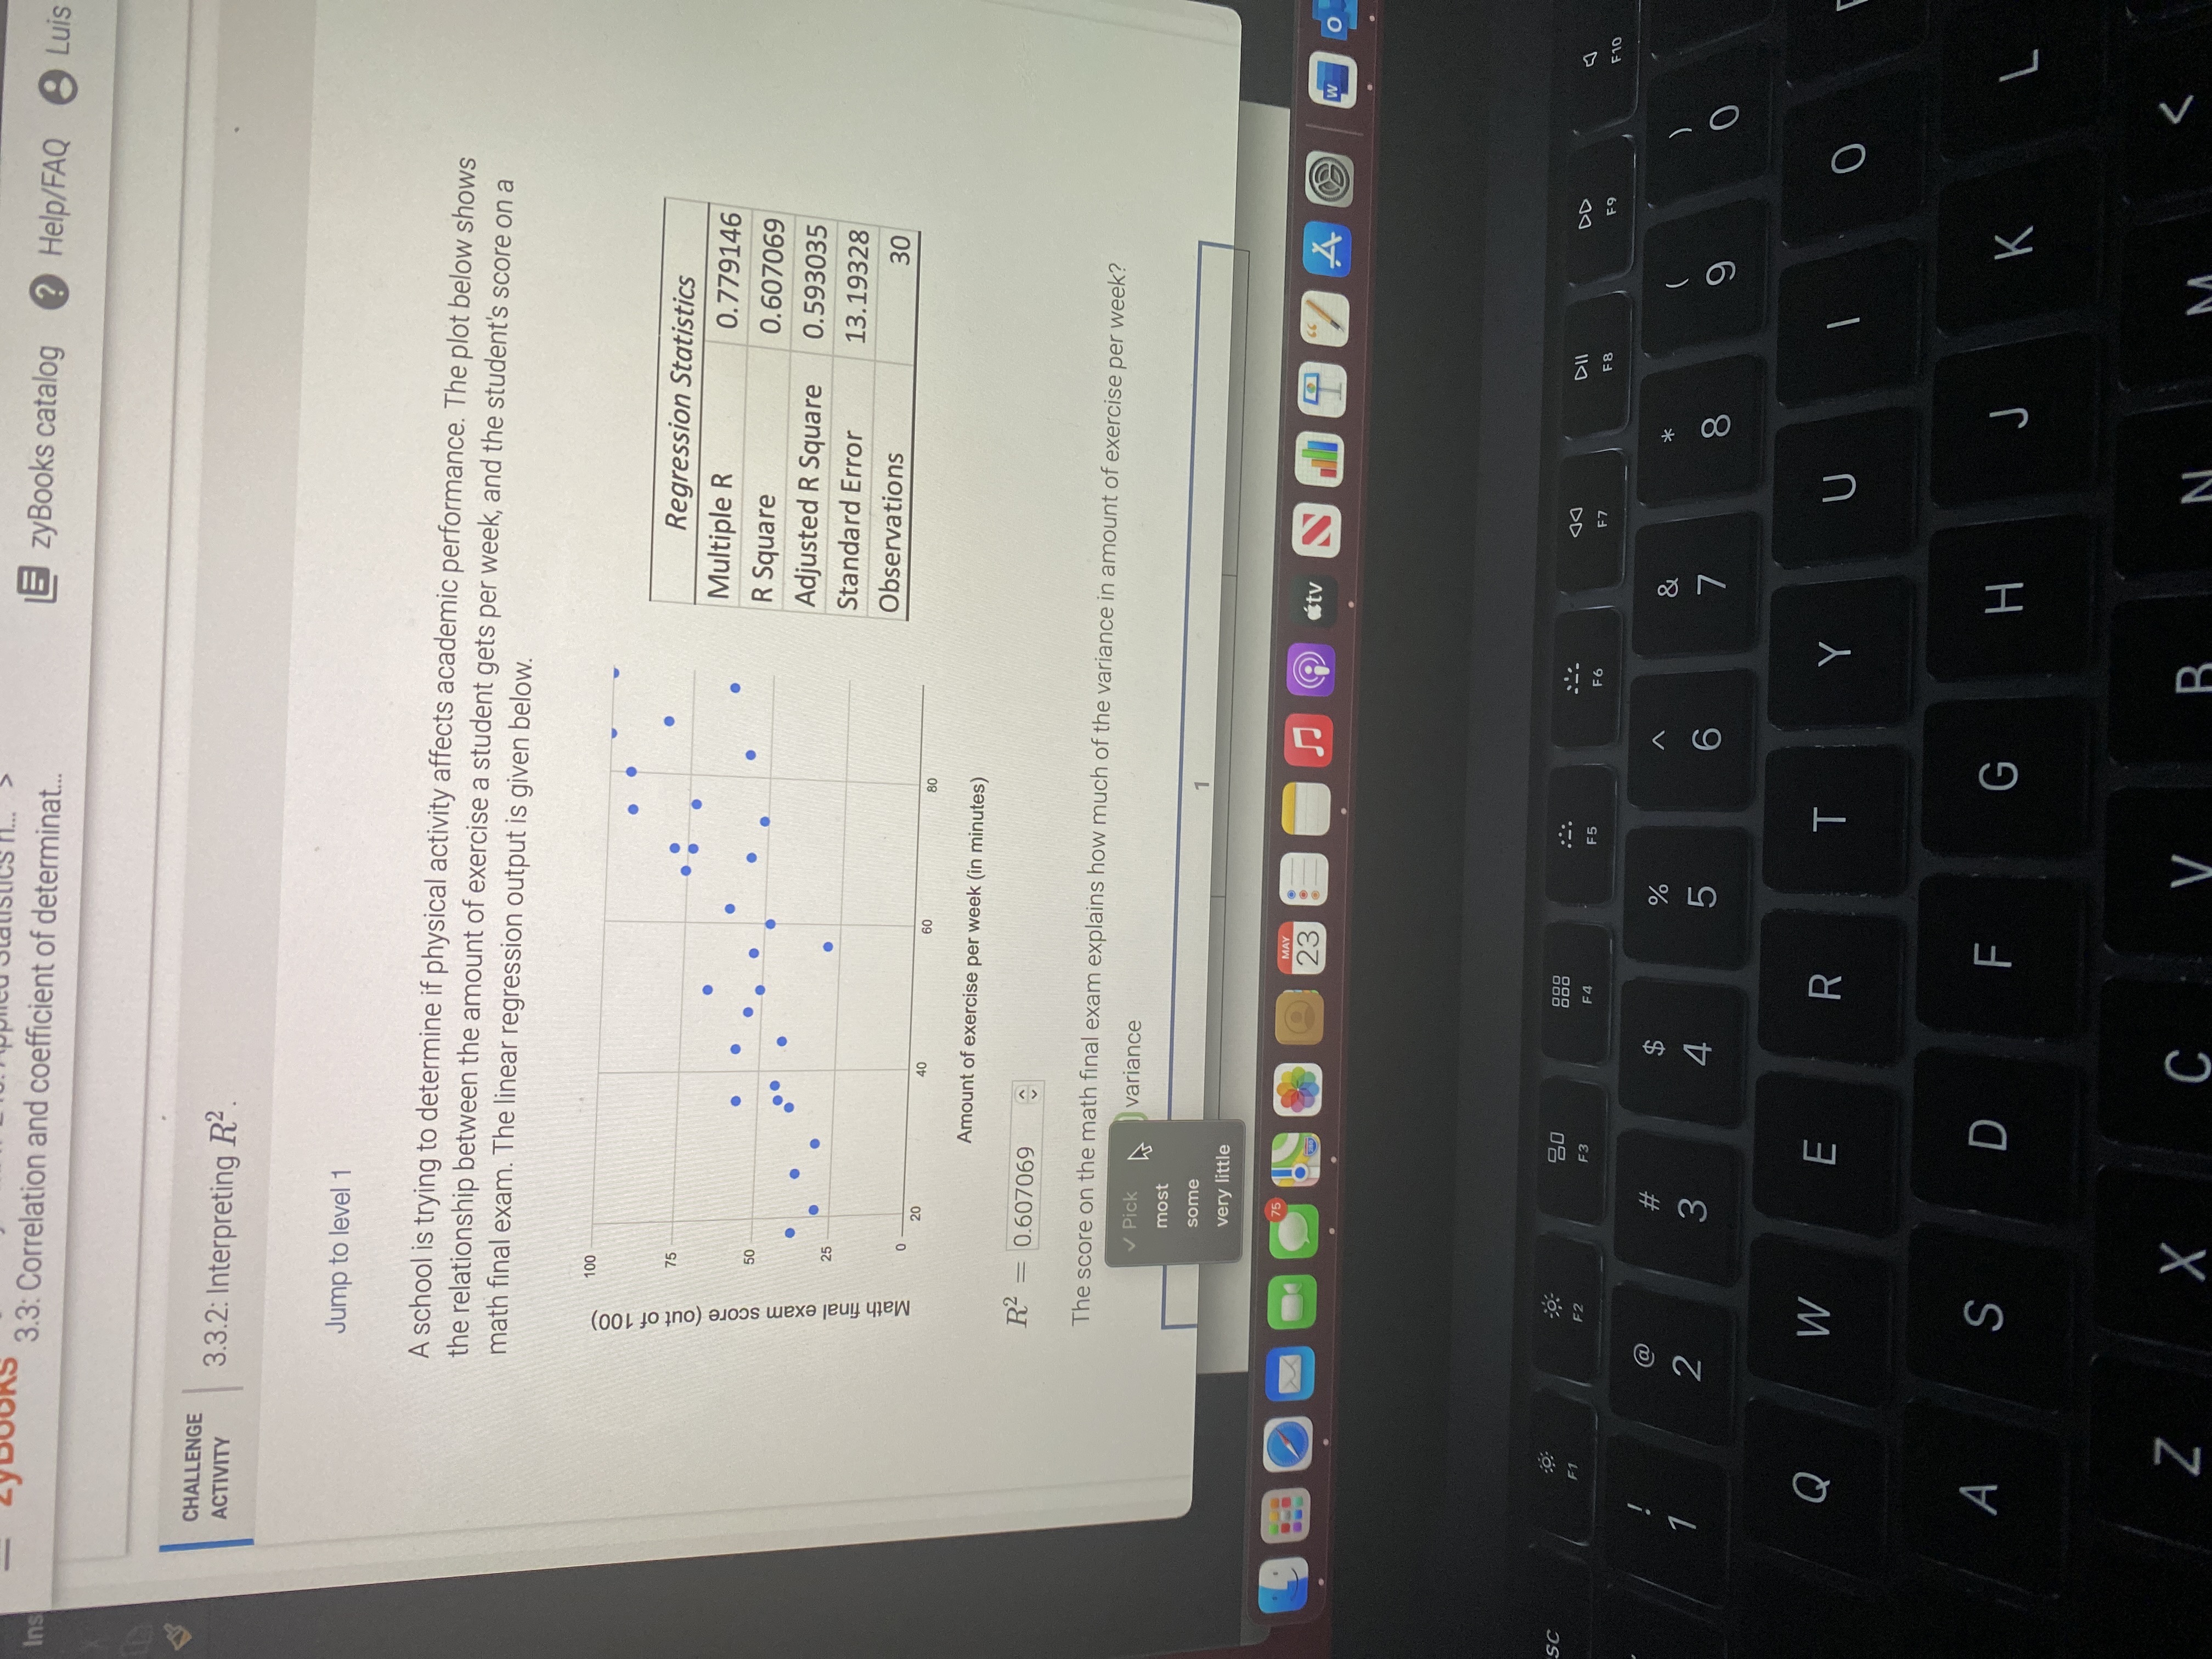
3.3: Correlation and coefficient of determinat. zyBooks catalog ? Help/FAQ Luis Ins CHALLENGE ACTIVITY 3.3.2: Interpreting R2. Jump to level 1 A school is trying to determine if physical activity affects academic performance. The plot below shows the relationship between the amount of exercise a student gets per week, and the student's score on a math final exam. The linear regression output is given below. Regression Statistics 75 Multiple R 0.779146 50 R Square 0.607069 Math final exam score (out of 100) Adjusted R Square 0.593035 Standard Error 13.19328 Observations 30 20 40 60 Amount of exercise per week (in minutes) R2 = 0.607069 The score on the math final exam explains how much of the variance in amount of exercise per week? variance most some very little 4 W O DD SC E7 F10 F3 # $ o & 2 3 5 6 Q W E R T Y U O A S D F G H K Z X V R
Step by Step Solution
There are 3 Steps involved in it

Get step-by-step solutions from verified subject matter experts