

Question: Question By means of graphical integration, calculate and plot the values of stage-1 orders and stage-2 orders for day 0 to 15. Consider an e-shop
Question By means of graphical integration, calculate and plot the values of stage-1 orders and stage-2 orders for day 0 to 15.
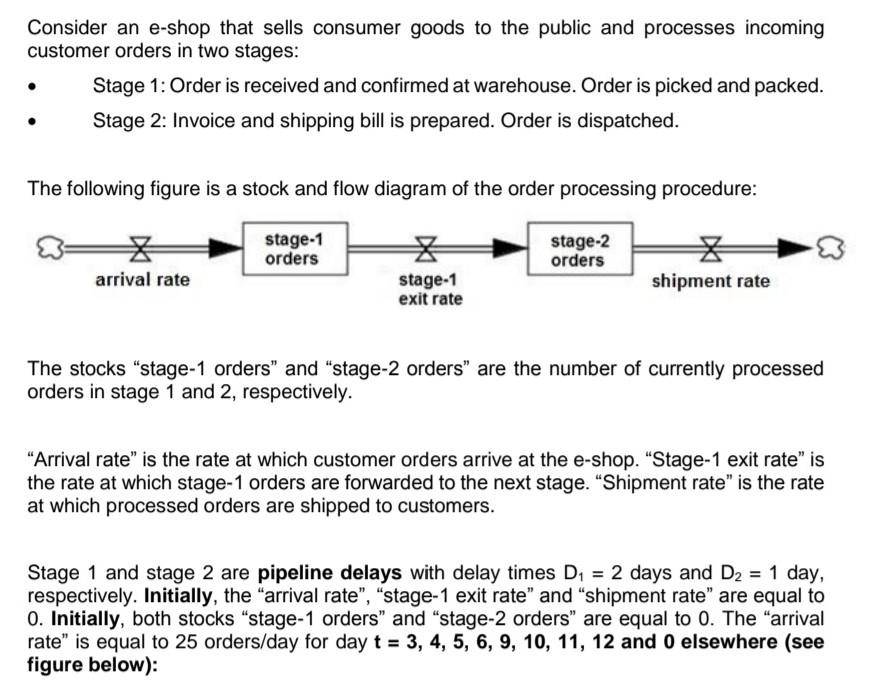
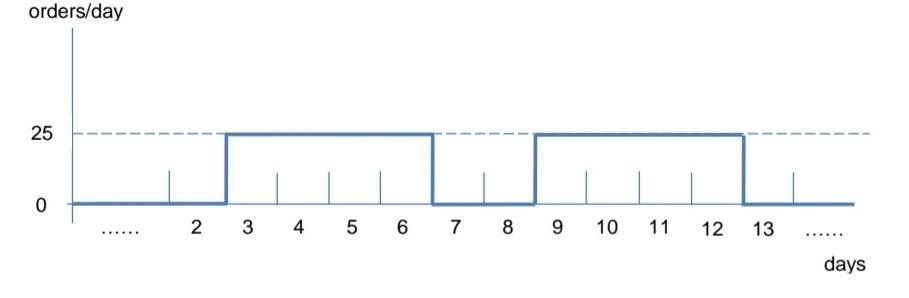
Consider an e-shop that sells consumer goods to the public and processes incoming customer orders in two stages: Stage 1: Order is received and confirmed at warehouse. Order is picked and packed. Stage 2: Invoice and shipping bill is prepared. Order is dispatched. The following figure is a stock and flow diagram of the order processing procedure: stage-1 orders stage-2 orders arrival rate stage-1 exit rate shipment rate The stocks "stage-1 orders" and "stage-2 orders are the number of currently processed orders in stage 1 and 2, respectively. Arrival rate is the rate at which customer orders arrive at the e-shop. "Stage-1 exit rate is the rate at which stage-1 orders are forwarded to the next stage. "Shipment rate" is the rate at which processed orders are shipped to customers. Stage 1 and stage 2 are pipeline delays with delay times D1 = 2 days and D2 = 1 day, respectively. Initially, the "arrival rate", "stage-1 exit rate" and "shipment rate" are equal to 0. Initially, both stocks "stage-1 orders and stage-2 orders are equal to 0. The "arrival rate" is equal to 25 orders/day for day t = 3, 4, 5, 6, 9, 10, 11, 12 and 0 elsewhere (see figure below): orders/day 25 0 2 3 4 5 6 7 8 9 9 10 11 12 13 daysStep by Step Solution
There are 3 Steps involved in it
1 Expert Approved Answer
Step: 1 Unlock

Question Has Been Solved by an Expert!
Get step-by-step solutions from verified subject matter experts
Step: 2 Unlock
Step: 3 Unlock