

Question: Question c and e Share Price -one year from now 0 60 130 220 300 400 Probability of an event happening 0.18 0.12 0.35 0.20
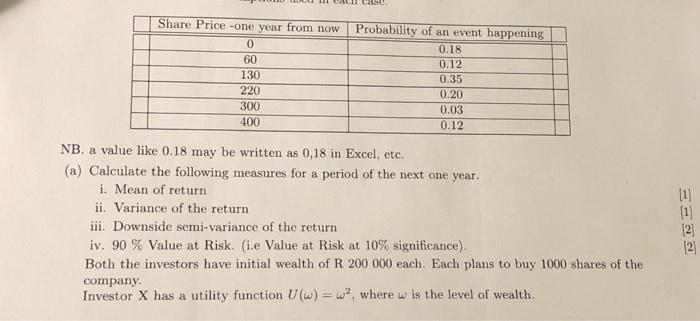
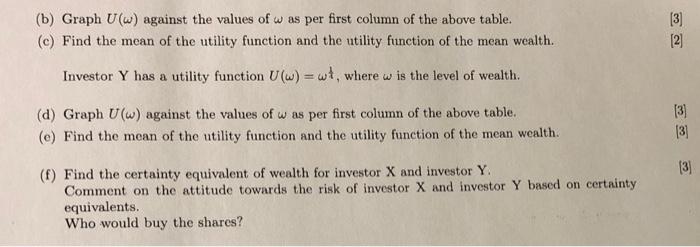
Share Price -one year from now 0 60 130 220 300 400 Probability of an event happening 0.18 0.12 0.35 0.20 0.03 0.12 NB. a value like 0.18 may be written as 0,18 in Excel, etc. (a) Calculate the following measures for a period of the next one year. i. Mean of return ii. Variance of the return iii. Downside semi-variance of the return iv. 90 % Value at Risk. (i.e Value at Risk at 10% significance). Both the investors have initial wealth of R 200 000 each. Each plans to buy 1000 shares of the 2 [2] company. Investor X has a utility function Uw) =w?, where w is the level of wealth (b) Graph U(w) against the values of w as per first column of the above table. (c) Find the mean of the utility function and the utility function of the mean wealth. (3) 12 Investor Y has a utility function U(w) = w, where w is the level of wealth. (d) Graph U(w) against the values of w as per first column of the above table. (e) Find the mean of the utility function and the utility function of the mean wealth [3] 131 [3] (f) Find the certainty equivalent of wealth for investor X and investor Y. Comment on the attitude towards the risk of investor X and investor Y based on certainty equivalents. Who would buy the shares
Step by Step Solution
There are 3 Steps involved in it

Get step-by-step solutions from verified subject matter experts