

Question: Question C Control charts for Xbar and s are maintained on a quality characteristic. The sample size is n15. After 30 samples, we have the
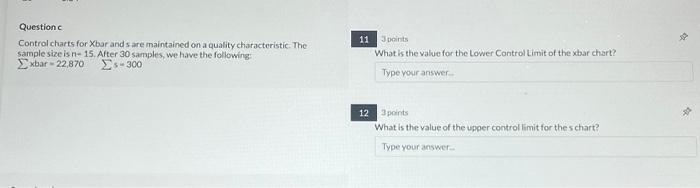
Question C Control charts for Xbar and s are maintained on a quality characteristic. The sample size is n15. After 30 samples, we have the following: xbar=22,870s=300 11 Jubints What is the value for the Lower Control timit of the xbar chart? 3 points What is the value of the upper control limit for the s chart
Step by Step Solution
There are 3 Steps involved in it
1 Expert Approved Answer
Step: 1 Unlock

Question Has Been Solved by an Expert!
Get step-by-step solutions from verified subject matter experts
Step: 2 Unlock
Step: 3 Unlock