

Question: Question c d e matlab b. We will now construct long-only portfolios of assets A and B. Define a vector of portfolio weights of Asset
Question c d e matlab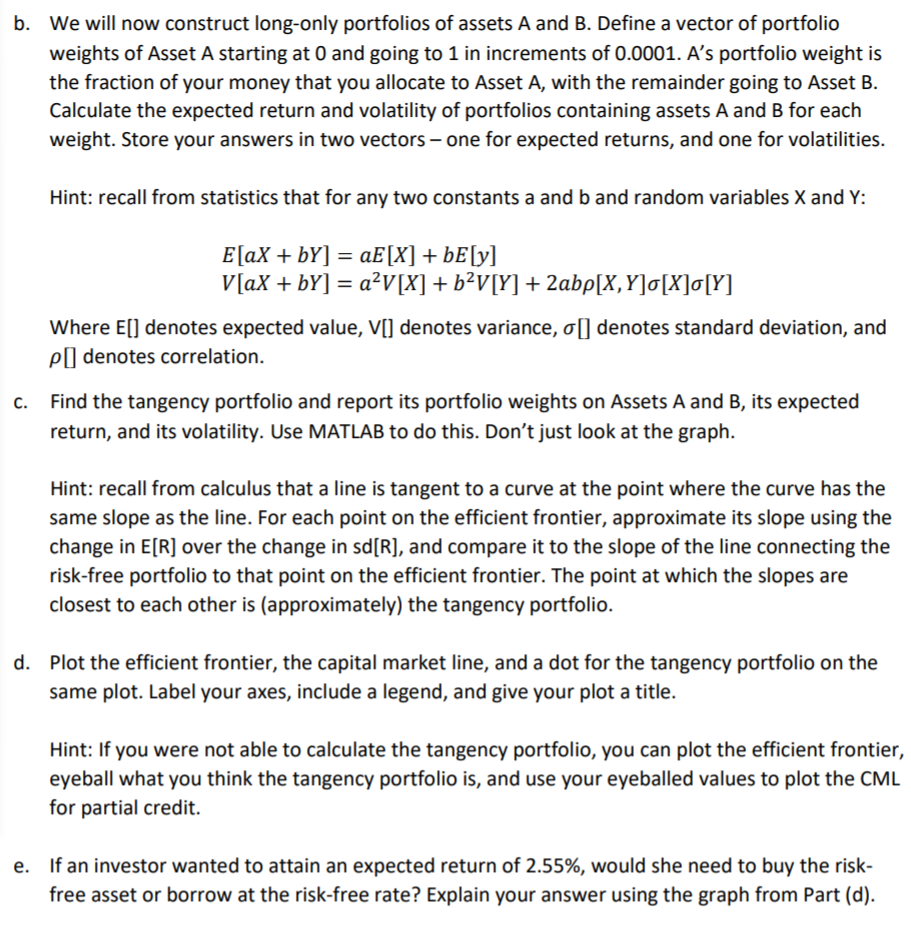
b. We will now construct long-only portfolios of assets A and B. Define a vector of portfolio weights of Asset A starting at 0 and going to 1 in increments of 0.0001. A's portfolio weight is the fraction of your money that you allocate to Asset A, with the remainder going to Asset B. Calculate the expected return and volatility of portfolios containing assets A and B for each weight. Store your answers in two vectors - one for expected returns, and one for volatilities. Hint: recall from statistics that for any two constants a and b and random variables X and Y: = = E[aX + bY] = aE[X] + bE[y] V[aX + bY] = a_V[X] + bV[Y] + 2abp[X,Y]0[X]0[Y] Where E[] denotes expected value, V[] denotes variance, o[] denotes standard deviation, and p[ denotes correlation. Find the tangency portfolio and report its portfolio weights on Assets A and B, its expected return, and its volatility. Use MATLAB to do this. Don't just look at the graph. Hint: recall from calculus that a line is tangent to a curve at the point where the curve has the same slope as the line. For each point on the efficient frontier, approximate its slope using the change in E[R] over the change in sd[R], and compare it to the slope of the line connecting the risk-free portfolio to that point on the efficient frontier. The point at which the slopes are closest to each other is (approximately) the tangency portfolio. d. Plot the efficient frontier, the capital market line, and a dot for the tangency portfolio on the same plot. Label your axes, include a legend, and give your plot a title. Hint: If you were not able to calculate the tangency portfolio, you can plot the efficient frontier, eyeball what you think the tangency portfolio is, and use your eyeballed values to plot the CML for partial credit. e. If an investor wanted to attain an expected return of 2.55%, would she need to buy the risk- free asset or borrow at the risk-free rate? Explain your answer using the graph from Part (d). b. We will now construct long-only portfolios of assets A and B. Define a vector of portfolio weights of Asset A starting at 0 and going to 1 in increments of 0.0001. A's portfolio weight is the fraction of your money that you allocate to Asset A, with the remainder going to Asset B. Calculate the expected return and volatility of portfolios containing assets A and B for each weight. Store your answers in two vectors - one for expected returns, and one for volatilities. Hint: recall from statistics that for any two constants a and b and random variables X and Y: = = E[aX + bY] = aE[X] + bE[y] V[aX + bY] = a_V[X] + bV[Y] + 2abp[X,Y]0[X]0[Y] Where E[] denotes expected value, V[] denotes variance, o[] denotes standard deviation, and p[ denotes correlation. Find the tangency portfolio and report its portfolio weights on Assets A and B, its expected return, and its volatility. Use MATLAB to do this. Don't just look at the graph. Hint: recall from calculus that a line is tangent to a curve at the point where the curve has the same slope as the line. For each point on the efficient frontier, approximate its slope using the change in E[R] over the change in sd[R], and compare it to the slope of the line connecting the risk-free portfolio to that point on the efficient frontier. The point at which the slopes are closest to each other is (approximately) the tangency portfolio. d. Plot the efficient frontier, the capital market line, and a dot for the tangency portfolio on the same plot. Label your axes, include a legend, and give your plot a title. Hint: If you were not able to calculate the tangency portfolio, you can plot the efficient frontier, eyeball what you think the tangency portfolio is, and use your eyeballed values to plot the CML for partial credit. e. If an investor wanted to attain an expected return of 2.55%, would she need to buy the risk- free asset or borrow at the risk-free rate? Explain your answer using the graph from Part (d)
Step by Step Solution
There are 3 Steps involved in it

Get step-by-step solutions from verified subject matter experts