

Question: Question C Use the contingency table to the right to complete parts (a) through (c) below. Total IN - Total 3. Find the expected frequency
Question C
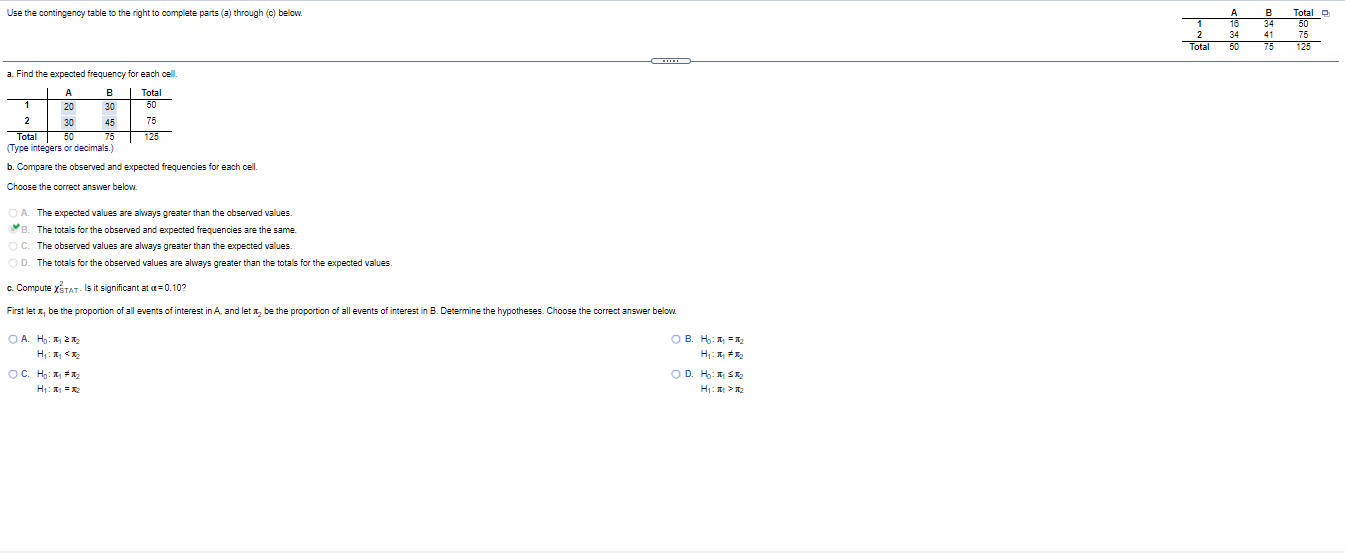
Use the contingency table to the right to complete parts (a) through (c) below. Total IN - Total 3. Find the expected frequency for each cell. A B Total 20 30 50 2 30 45 75 Total 50 125 (Type integers or decimals.) b. Compare the observed and expected frequencies for each cell. Choose the correct answer below. O A. The expected values are always greater than the observed values. B. The totals for the observed and expected frequencies are the same. O C. The observed values are always greater than the expected values. O D. The totals for the observed values are always greater than the totals for the expected values. c. Compute XSTAT - Is it significant at a= 0.10? First let x be the proportion of all events of interest in A, and let it be the proportion of all events of interest in B. Determine the hypotheses. Choose the correct answer below. OA. HI: 1 212 O B. HO: M = 12 OC. HO: 1 # 12 O D. Ho: M SEZ H1: 1 = 12 H1: M > 12
Step by Step Solution
There are 3 Steps involved in it

Get step-by-step solutions from verified subject matter experts