

Question: Question Completion Status: 2 30 5 6 7 8 9 10 QUESTION 6 The following exhibit illustrates the distribution of expected net cash flows
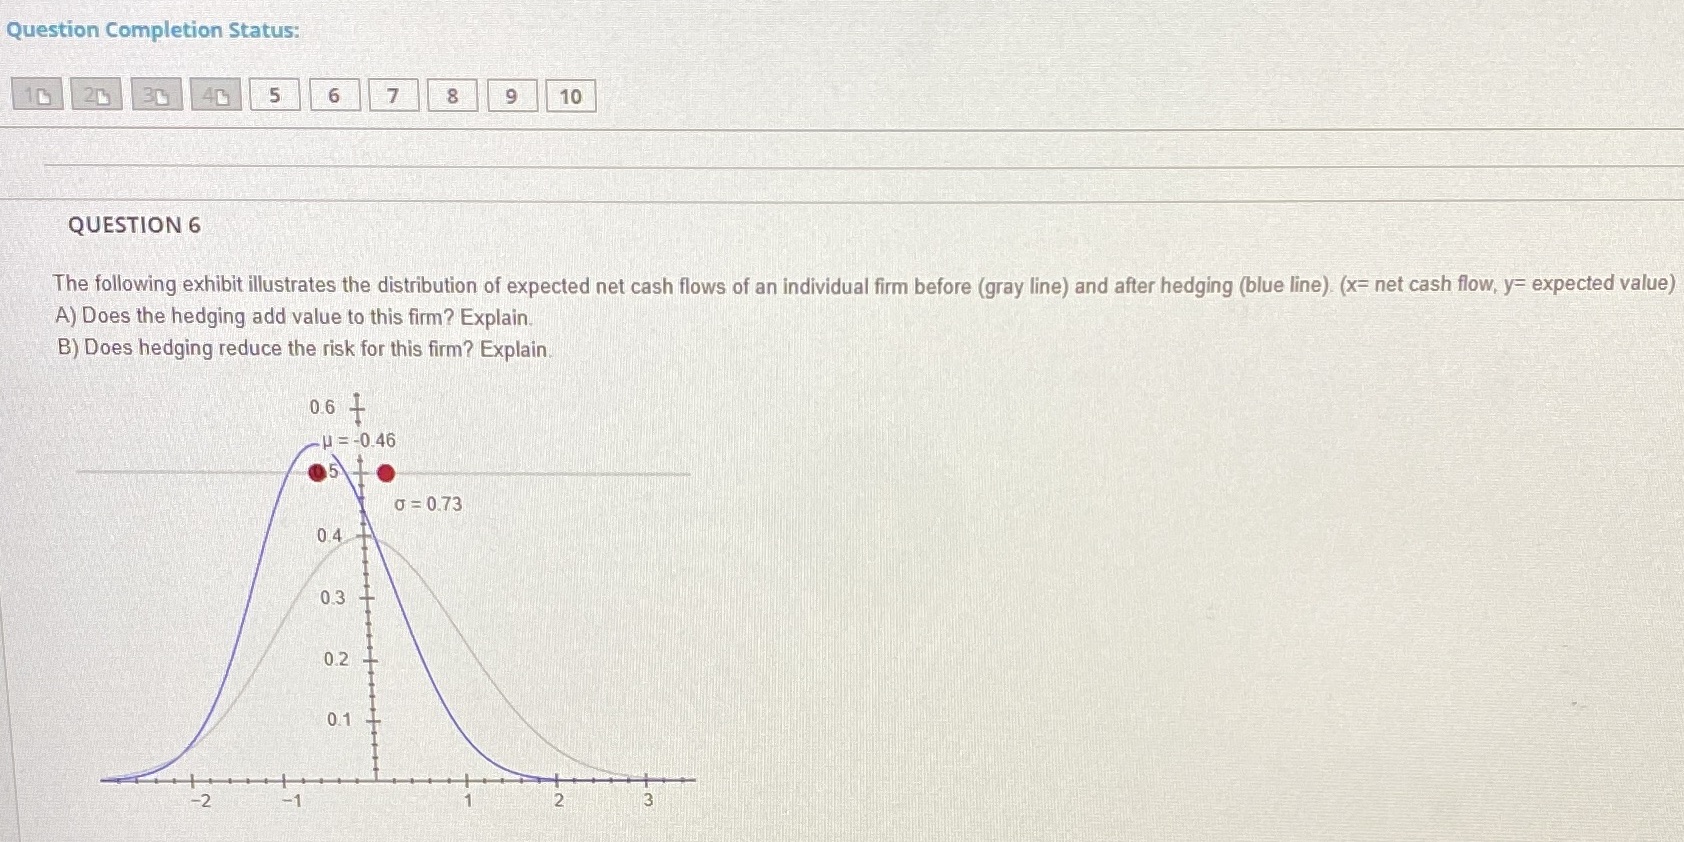
Question Completion Status: 2 30 5 6 7 8 9 10 QUESTION 6 The following exhibit illustrates the distribution of expected net cash flows of an individual firm before (gray line) and after hedging (blue line). (x= net cash flow, y= expected value) A) Does the hedging add value to this firm? Explain. B) Does hedging reduce the risk for this firm? Explain. 0.6 + -=-0.46 -2 -1 0.4 0.3 0.2 0.1 = 0.73 2 3
Step by Step Solution
There are 3 Steps involved in it
1 Expert Approved Answer
Step: 1 Unlock

Question Has Been Solved by an Expert!
Get step-by-step solutions from verified subject matter experts
Step: 2 Unlock
Step: 3 Unlock