

Question: Question Completion Status: Normal Z-Table [Week 10 PPT & Video] According to the Normal Z-Table shown above, the probability that a sample from a normat
![Question Completion Status: Normal Z-Table [Week 10 PPT \& Video] According](https://dsd5zvtm8ll6.cloudfront.net/si.experts.images/questions/2024/10/671fb711edb02_729671fb711e428c.jpg)
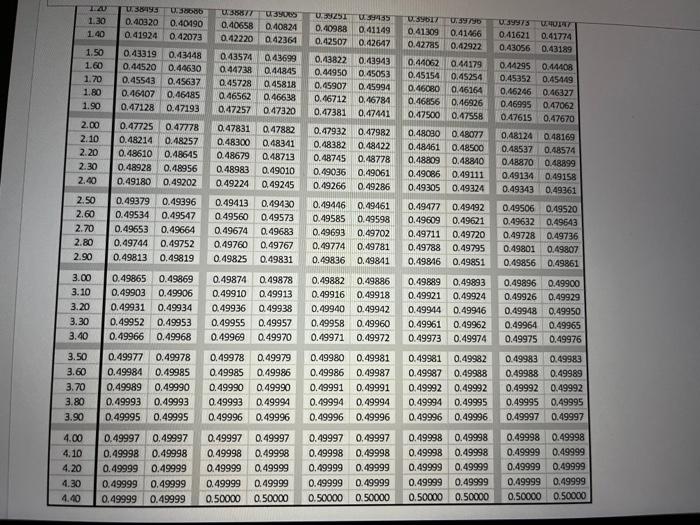
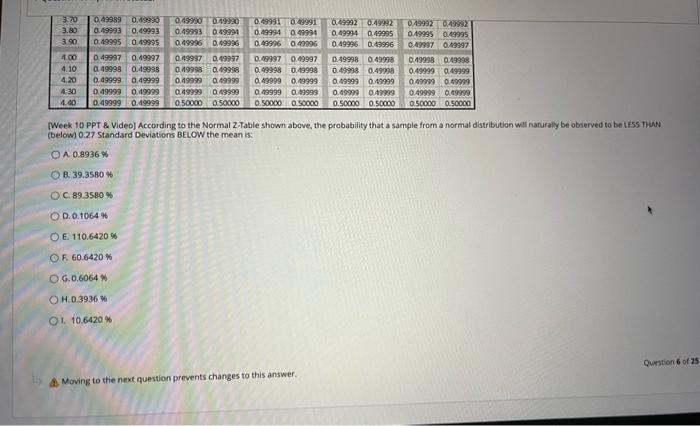
Question Completion Status: Normal Z-Table [Week 10 PPT \& Video] According to the Normal Z-Table shown above, the probability that a sample from a normat distribution will naturally be observed to be tFs5 Thin (below) 0.27 Standard Deviations BELOW the mean is: A. 0.8936% 8. 39.3580 * C. 89.3580% D. 0,10647 E. 110.6420% F. 60.6420 \% G. 0.6064 H. 0.3936 * 1. 10.6420% (4) Moving to the next question prevents changes to this answer. Question Completion Status: Normal Z-Table [Week 10 PPT \& Video] According to the Normal Z-Table shown above, the probability that a sample from a normat distribution will naturally be observed to be tFs5 Thin (below) 0.27 Standard Deviations BELOW the mean is: A. 0.8936% 8. 39.3580 * C. 89.3580% D. 0,10647 E. 110.6420% F. 60.6420 \% G. 0.6064 H. 0.3936 * 1. 10.6420% (4) Moving to the next question prevents changes to this
Step by Step Solution
There are 3 Steps involved in it

Get step-by-step solutions from verified subject matter experts