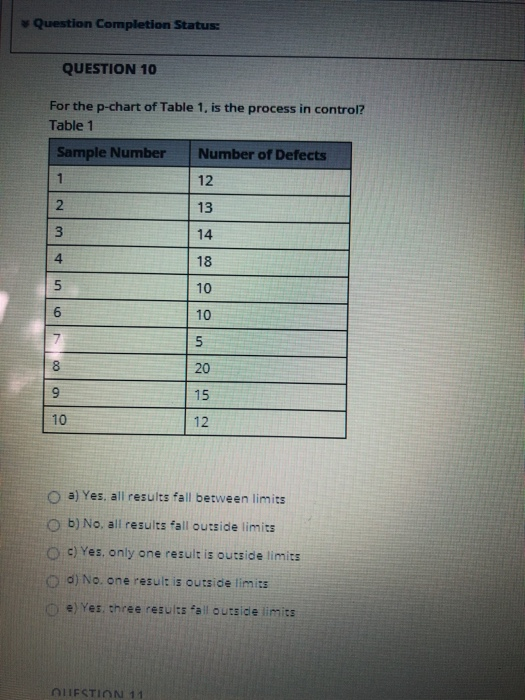
Question: Question Completion Status: QUESTION 10 For the p-chart of Table 1, is the process in control? Table 1 Sample Number Number of Defects 1 12

Question Completion Status: QUESTION 10 For the
Question Completion Status: QUESTION 10 For the p-chart of Table 1, is the process in control? Table 1 Sample Number Number of Defects 1 12 N 13 3 14 4 18 5 10 6 10 5 20 9 15 10 12 a) Yes, all results fall between limits b) No. all results fall outside limits OC) Yes, only one result is outside limits d) No. one result is outside limits e) Yes, three results fall outside limits TIFSTION 11 Question Completion Status: QUESTION 10 For the p-chart of Table 1, is the process in control? Table 1 Sample Number Number of Defects 1 12 N 13 3 14 4 18 5 10 6 10 5 20 9 15 10 12 a) Yes, all results fall between limits b) No. all results fall outside limits OC) Yes, only one result is outside limits d) No. one result is outside limits e) Yes, three results fall outside limits TIFSTION 11

Step by Step Solution

There are 3 Steps involved in it

1 Expert Approved Answer
Step: 1 Unlock blur-text-image
Question Has Been Solved by an Expert!

Get step-by-step solutions from verified subject matter experts

Step: 2 Unlock
Step: 3 Unlock

Students Have Also Explored These Related General Management Questions!