

Question: Question Completion Status: QUESTION 7 10 point The following are diagnostic plots for a linear regression model. Give a brief description of these plots. In
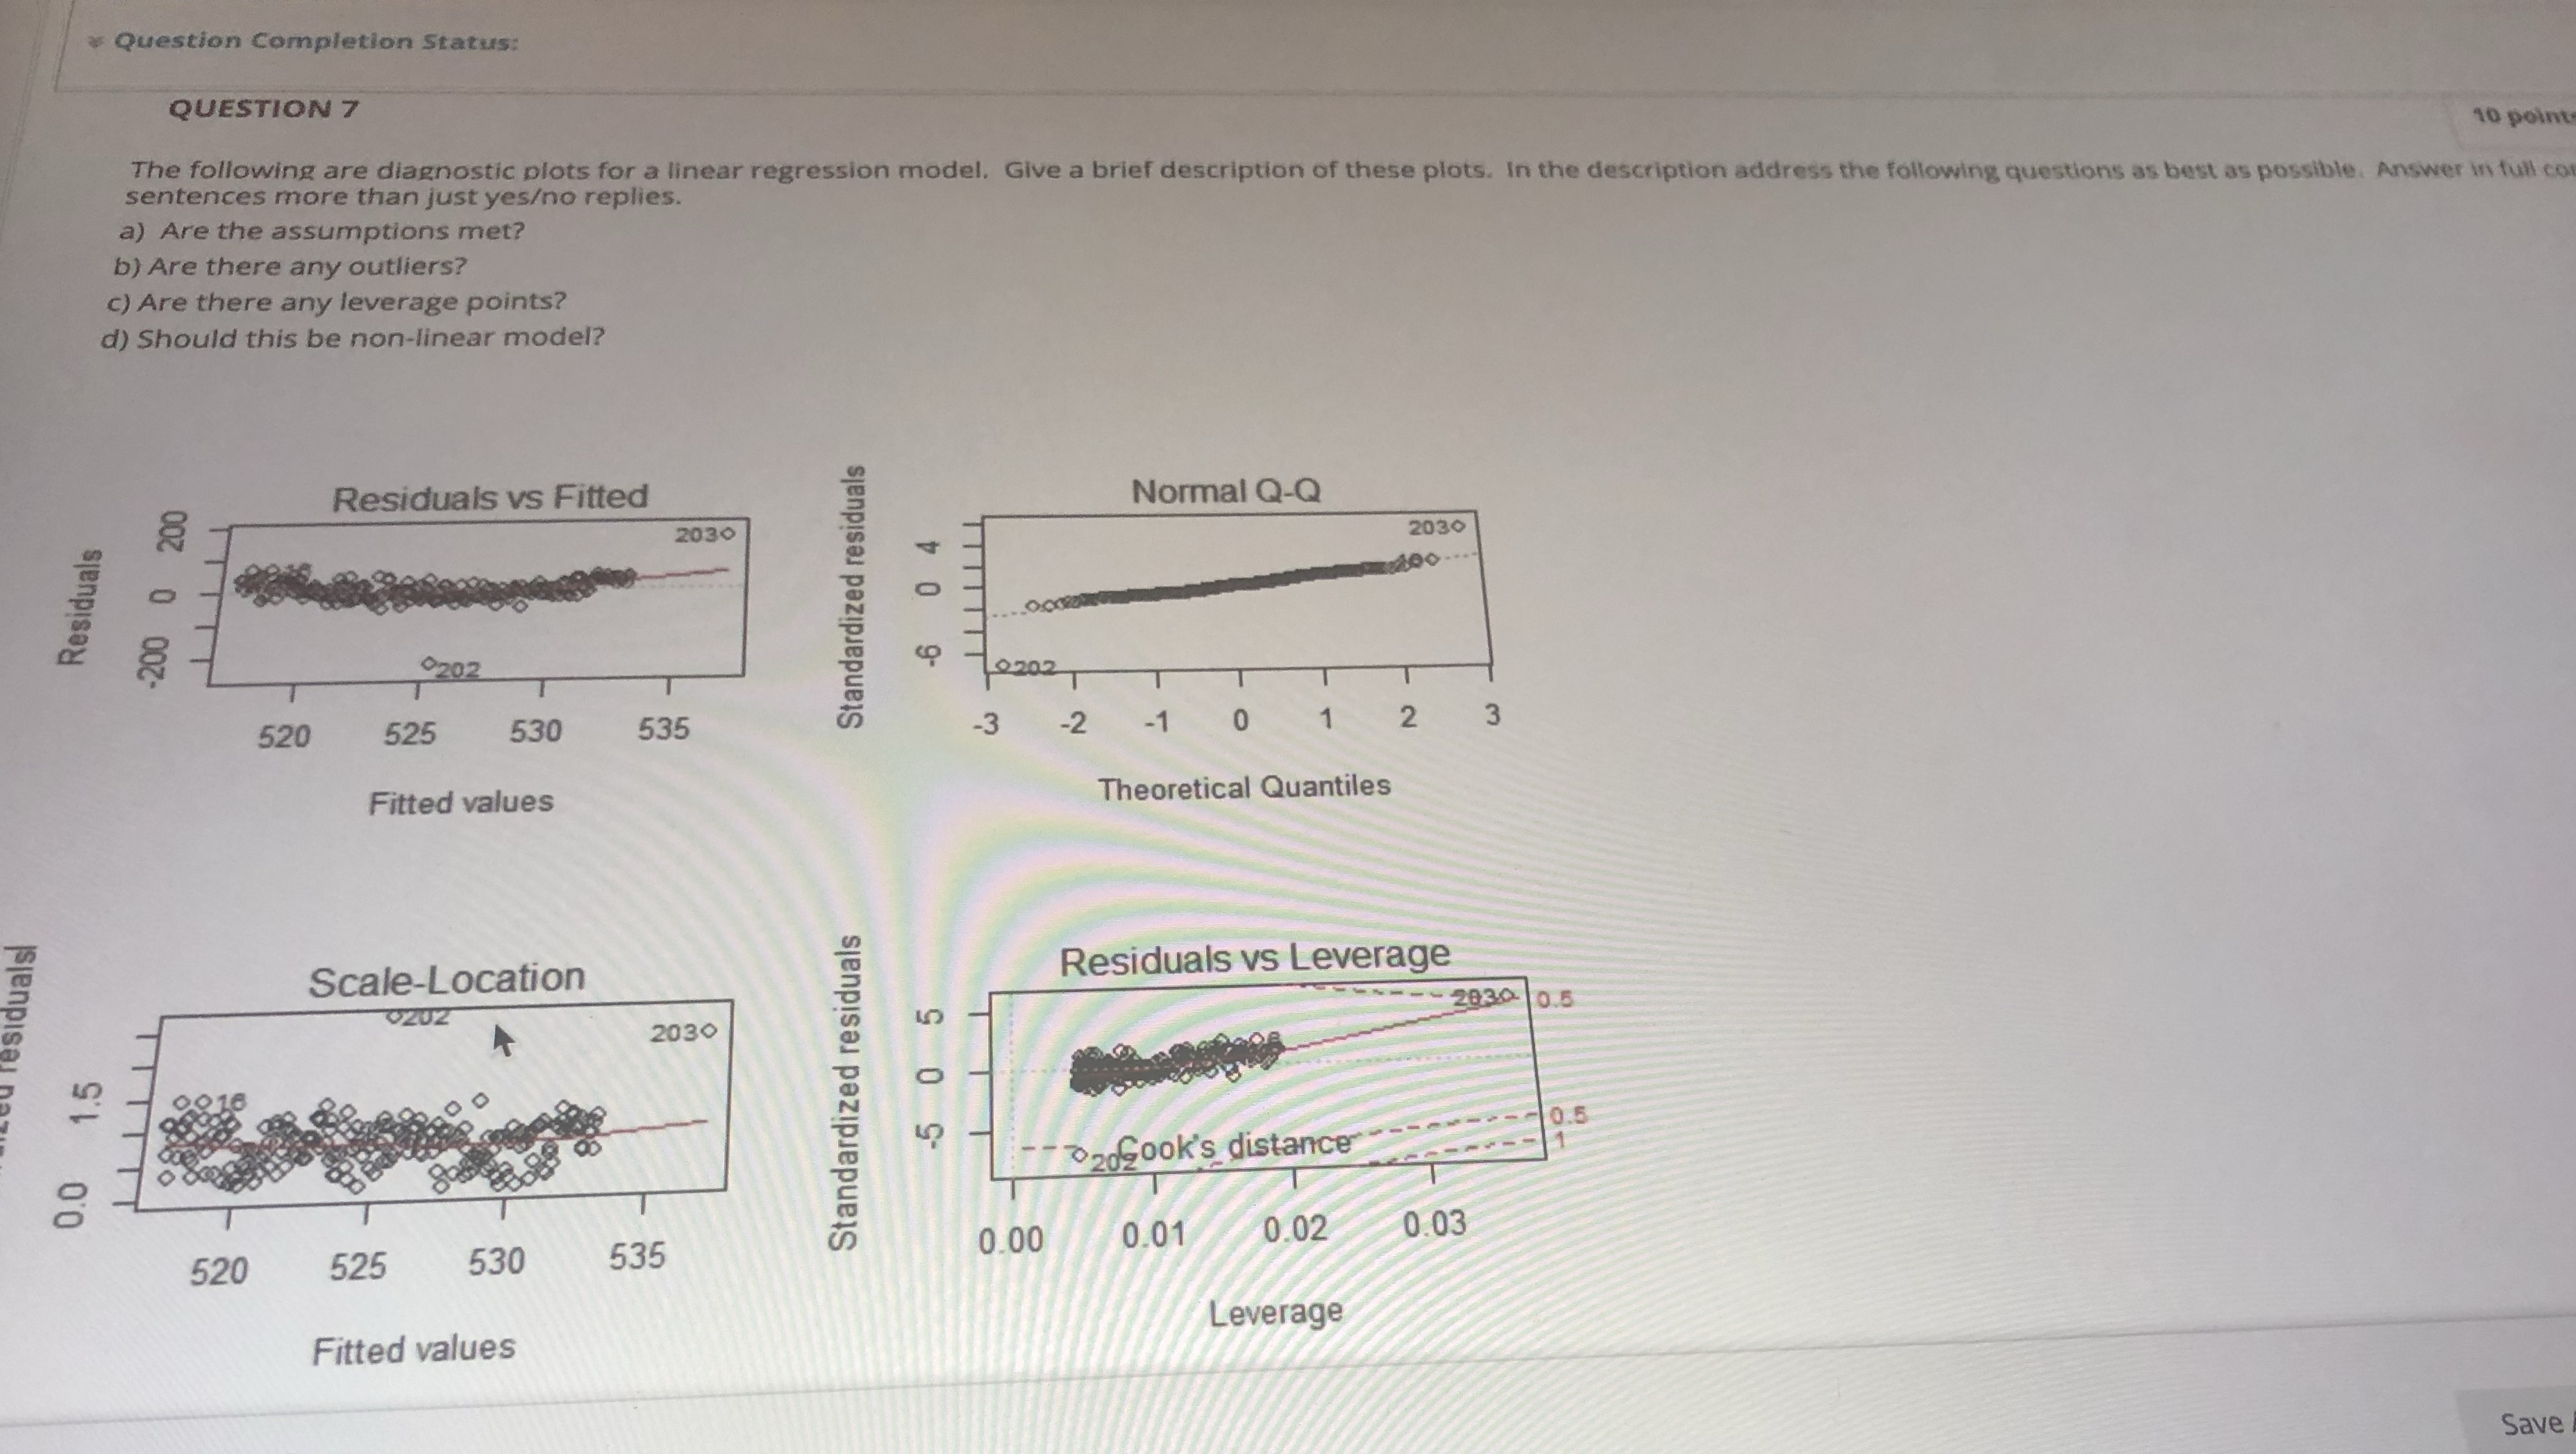
Question Completion Status: QUESTION 7 10 point The following are diagnostic plots for a linear regression model. Give a brief description of these plots. In the description address the following questions as best as possible. Answer in full co sentences more than just yeso replies. a) Are the assumptions met? b) Are there any outliers? c) Are there any leverage points? d) Should this be non-linear model? Residuals vs Fitted Normal Q-Q 2030 2030 0 4 TTTTTTT Standardized residuals Residuals 200 0 2 0202 2202 520 525 530 535 -3 -2 -1 0 2 3 Fitted values Theoretical Quantiles Scale-Location Residuals vs Leverage residuals 0202 - 2030 0.5 2030 - 5 0 5 9010 Standardized residuals LL 0.0 1.5 20Cook's distance-0.5 0.00 0.01 0.02 0.03 520 525 530 535 Leverage Fitted values Save
Step by Step Solution
There are 3 Steps involved in it

Get step-by-step solutions from verified subject matter experts