

Question: Question Completion Status: QUESTION 9 Imagination Corporation - Common Size Financial Statements, Ratio Analysis and Planning You were hire by Imagination Corporation to assist the
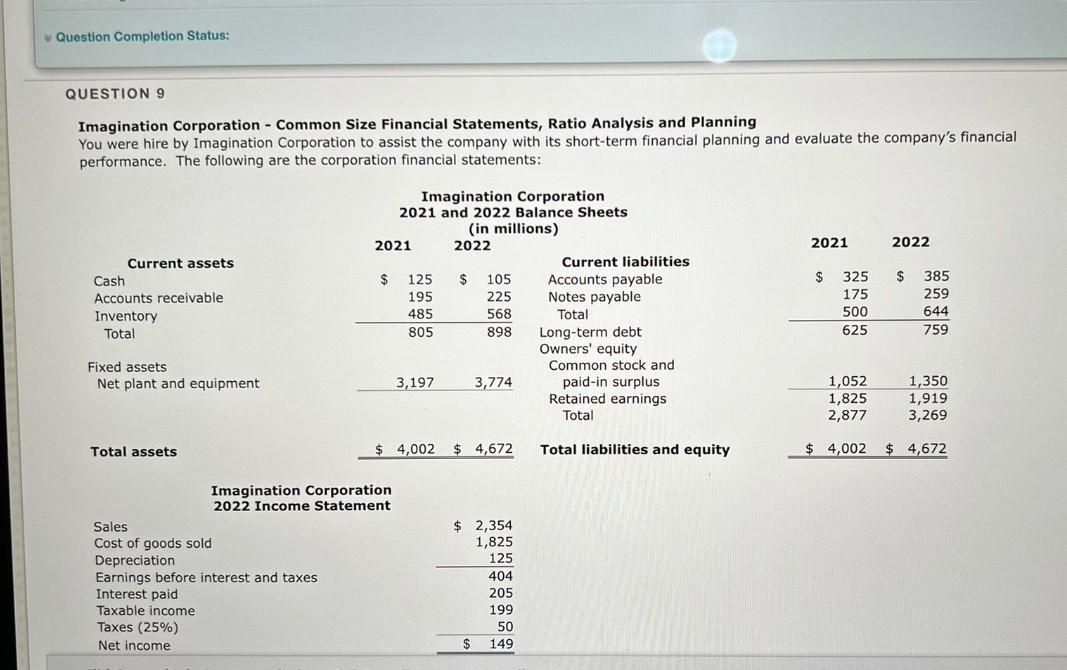
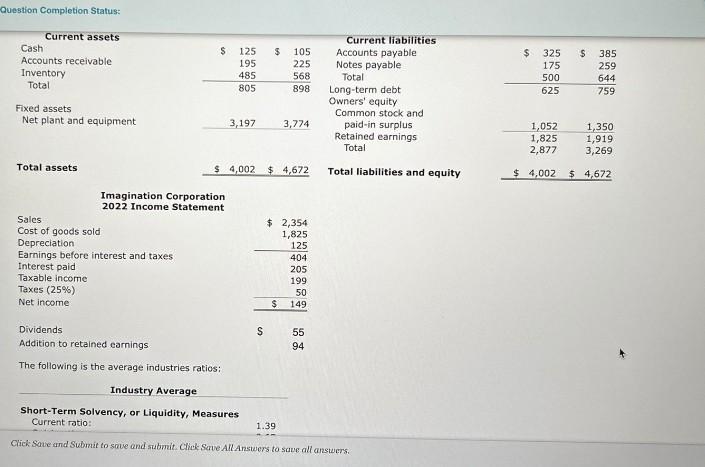
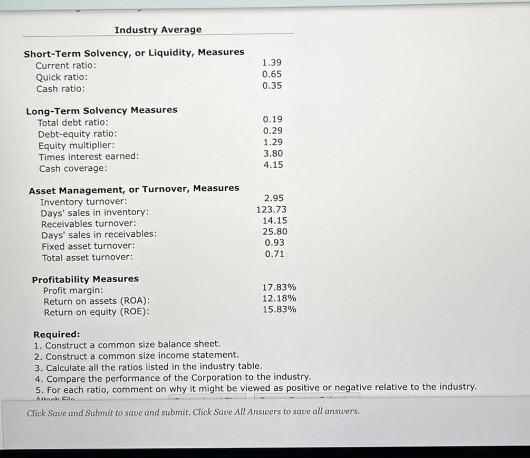
Question Completion Status: QUESTION 9 Imagination Corporation - Common Size Financial Statements, Ratio Analysis and Planning You were hire by Imagination Corporation to assist the company with its short-term financial planning and evaluate the company's financial performance. The following are the corporation financial statements: 2021 2022 $ Current assets Cash Accounts receivable Inventory Total Imagination Corporation 2021 and 2022 Balance Sheets (in millions) 2021 2022 Current liabilities $ 125 $ 105 Accounts payable 195 225 Notes payable 485 568 Total 805 898 Long-term debt Owners' equity Common stock and 3,197 3,774 paid-in surplus Retained earnings Total $ 325 175 500 625 385 259 644 759 Fixed assets Net plant and equipment 1,052 1,825 2,877 1,350 1,919 3,269 Total assets $ 4,002 $ 4,672 Total liabilities and equity $ 4,002 $ 4,672 Imagination Corporation 2022 Income Statement Sales Cost of goods sold Depreciation Earnings before interest and taxes Interest paid Taxable income Taxes (25%) Net income $ 2,354 1,825 125 404 205 199 50 $ 149 Question Completion Status: $ $ $ $ $ Current assets Cash Accounts receivable Inventory Total 125 195 485 805 105 225 568 Current liabilities Accounts payable Notes payable Total Long-term debt Owners' equity Common stock and paid-in surplus Retained earnings Total 325 175 500 625 385 259 644 759 898 Fixed assets Net plant and equipment 3,197 3,774 1,052 1,825 2,877 1,350 1,919 3,269 Total assets $ 4,002 $ 4,672 Total liabilities and equity $ 4,002 $ 4,672 Imagination Corporation 2022 Income Statement Sales Cost of goods sold Depreciation Earnings before interest and taxes Interest paid Taxable income Taxes (25%) Net income $ 2,354 1,825 125 404 205 199 50 $ 149 S Dividends Addition to retained earnings 55 94 The following is the average industries ratios: Industry Average Short-Term Solvency, or Liquidity, Measures Current ratio: 1.39 Click Save and Submit to save and submit. Click Save All Answers to save all answers 1.39 0.65 0.35 Industry Average Short-Term Solvency, or Liquidity, Measures Current ratio: Quick ratio: Cash ratio: Long-Term Solvency Measures Total debt ratio: Debt-equity ratio: Equity multiplier: Times interest earned: Cash coverage: 0.19 0.29 1.29 3.80 4.15 Asset Management, or Turnover, Measures Inventory turnover: Days' sales in inventory: Receivables turnover: Days' sales in receivables: Fixed asset turnover: Total asset turnover: 2.95 123.73 14.15 25.80 0.93 0.71 Profitability Measures Profit margin: Return on assets (ROA) Return on equity (ROE): 17.83% 12.18% 15.83% Required: 1. Construct a common size balance sheet. 2. Construct a common size income statement. 3. Calculate all the ratios listed in the industry table. 4. Compare the performance of the Corporation to the industry. 5. For each ratio, comment on why it might be viewed as positive or negative relative to the industry. Ancol Click Save and Submit to save and submit. Click Save All Ansicers to save all answers. Question Completion Status: QUESTION 9 Imagination Corporation - Common Size Financial Statements, Ratio Analysis and Planning You were hire by Imagination Corporation to assist the company with its short-term financial planning and evaluate the company's financial performance. The following are the corporation financial statements: 2021 2022 $ Current assets Cash Accounts receivable Inventory Total Imagination Corporation 2021 and 2022 Balance Sheets (in millions) 2021 2022 Current liabilities $ 125 $ 105 Accounts payable 195 225 Notes payable 485 568 Total 805 898 Long-term debt Owners' equity Common stock and 3,197 3,774 paid-in surplus Retained earnings Total $ 325 175 500 625 385 259 644 759 Fixed assets Net plant and equipment 1,052 1,825 2,877 1,350 1,919 3,269 Total assets $ 4,002 $ 4,672 Total liabilities and equity $ 4,002 $ 4,672 Imagination Corporation 2022 Income Statement Sales Cost of goods sold Depreciation Earnings before interest and taxes Interest paid Taxable income Taxes (25%) Net income $ 2,354 1,825 125 404 205 199 50 $ 149 Question Completion Status: $ $ $ $ $ Current assets Cash Accounts receivable Inventory Total 125 195 485 805 105 225 568 Current liabilities Accounts payable Notes payable Total Long-term debt Owners' equity Common stock and paid-in surplus Retained earnings Total 325 175 500 625 385 259 644 759 898 Fixed assets Net plant and equipment 3,197 3,774 1,052 1,825 2,877 1,350 1,919 3,269 Total assets $ 4,002 $ 4,672 Total liabilities and equity $ 4,002 $ 4,672 Imagination Corporation 2022 Income Statement Sales Cost of goods sold Depreciation Earnings before interest and taxes Interest paid Taxable income Taxes (25%) Net income $ 2,354 1,825 125 404 205 199 50 $ 149 S Dividends Addition to retained earnings 55 94 The following is the average industries ratios: Industry Average Short-Term Solvency, or Liquidity, Measures Current ratio: 1.39 Click Save and Submit to save and submit. Click Save All Answers to save all answers 1.39 0.65 0.35 Industry Average Short-Term Solvency, or Liquidity, Measures Current ratio: Quick ratio: Cash ratio: Long-Term Solvency Measures Total debt ratio: Debt-equity ratio: Equity multiplier: Times interest earned: Cash coverage: 0.19 0.29 1.29 3.80 4.15 Asset Management, or Turnover, Measures Inventory turnover: Days' sales in inventory: Receivables turnover: Days' sales in receivables: Fixed asset turnover: Total asset turnover: 2.95 123.73 14.15 25.80 0.93 0.71 Profitability Measures Profit margin: Return on assets (ROA) Return on equity (ROE): 17.83% 12.18% 15.83% Required: 1. Construct a common size balance sheet. 2. Construct a common size income statement. 3. Calculate all the ratios listed in the industry table. 4. Compare the performance of the Corporation to the industry. 5. For each ratio, comment on why it might be viewed as positive or negative relative to the industry. Ancol Click Save and Submit to save and submit. Click Save All Ansicers to save all answers
Step by Step Solution
There are 3 Steps involved in it

Get step-by-step solutions from verified subject matter experts