

Question: Question Content Area NPV, Make or Buy, MACRS, Basic Analysis Jonfran Company manufactures three different models of paper shredders including the waste container, which serves
Question Content Area
NPV, Make or Buy, MACRS, Basic Analysis
Jonfran Company manufactures three different models of paper shredders including the waste container, which serves as the base. While the shredder heads are different for all three models, the waste container is the same. The number of waste containers that Jonfran will need during the following years is estimated as follows:
| 20x5 | 50,000 |
| 20x6 | 50,000 |
| 20x7 | 52,000 |
| 20x8 | 55,000 |
| 20x9 | 55,000 |
The equipment used to manufacture the waste container must be replaced because it is broken and cannot be repaired. The new equipment would have a purchase price of $945,000 with terms of 2/10, n/30; the company's policy is to take all purchase discounts. The freight on the equipment would be $11,000, and installation costs would total $22,900. The equipment would be purchased in December 20x4 and placed into service on January 1, 20x5. It would have a five-year economic life and would be treated as three-year property under MACRS. This equipment is expected to have a salvage value of $12,000 at the end of its economic life in 20x9. The new equipment would be more efficient than the old equipment, resulting in a 25 percent reduction in both direct materials and variable overhead. The savings in direct materials would result in an additional one-time decrease in working capital requirements of $2,500, resulting from a reduction in direct material inventories. This working capital reduction would be recognized at the time of equipment acquisition.
The old equipment is fully depreciated and is not included in the fixed overhead. The old equipment from the plant can be sold for a salvage amount of $1,500. Rather than replace the equipment, one of Jonfran's production managers has suggested that the waste containers be purchased. One supplier has quoted a price of $27 per container. This price is $8 less than Jonfran's current manufacturing cost, which is as follows:
| Direct materials | $10 | |||
| Direct labor | 8 | |||
| Variable overhead | 6 | |||
| Fixed overhead: | ||||
| Supervision | $2 | |||
| Facilities | 5 | |||
| General | 4 | 11 | ||
| Total unit cost | $35 |
Jonfran uses a plantwide fixed overhead rate in its operations. If the waste containers are purchased outside, the salary and benefits of one supervisor, included in fixed overhead at $45,000, would be eliminated. There would be no other changes in the other cash and noncash items included in fixed overhead except depreciation on the new equipment.
Jonfran is subject to a 25 percent tax rate. Management assumes that all cash flows occur at the end of the year and uses a 12 percent after-tax discount rate.
You must use the Exhibit 19B.1 and Exhibit 19B.2 present value tables and Exhibit 19.5 to solve the following problems.
Required:
Question Content Area
1. Make a schedule of cash flows for the make alternative. Enter cash outflows as negative amounts and cash inflows as positive amounts. Round your answers to the nearest dollar when rounding is required.
| Item | CF |
| Year 20x4 | |
| Equipment | $ |
| Discount | $ |
| Freight | $ |
| Installation | $ |
| Salvage-old | $ |
| Working capital reduction | $ |
| Total | $ |
| Year 20x5 | |
| Operating expenses | $ |
| Depreciation tax shield | $ |
| Total | $ |
| Year 20x6 | |
| Operating expenses | $ |
| Depreciation tax shield | $ |
| Total | $ |
| Year 20x7 | |
| Operating expenses | $ |
| Depreciation tax shield | |
| Total | $ |
| Year 20x8 | |
| Operating expenses | $ |
| Depreciation tax shield | |
| Total | $ |
| Year 20x9 | |
| Operating expenses | $ |
| Salvage-new | |
| Total | $ |
Question Content Area
Calculate the NPV of the make alternative. Round intermediate calculations and your final answer to the nearest dollar. If the NPV is negative, enter your answer as a negative value.
$
Question Content Area
2. Make a schedule of cash flows for the buy alternative. Enter cash outflows as negative amounts and cash inflows as positive amounts.
| Item | CF |
| Year 20x4 | |
| Salvage-old | $ |
| Year 20x5 | |
| Purchase cost | |
| Year 20x6 | |
| Purchase cost: | |
| Year 20x7 | |
| Purchase cost: | |
| Year 20x8 | |
| Purchase cost: | |
| Year 20x9 | |
| Purchase cost: |
Question Content Area
Calculate the NPV of the buy alternative. Round intermediate calculations and your final answer to the nearest dollar. If the NPV is negative, enter your answer as a negative value. $
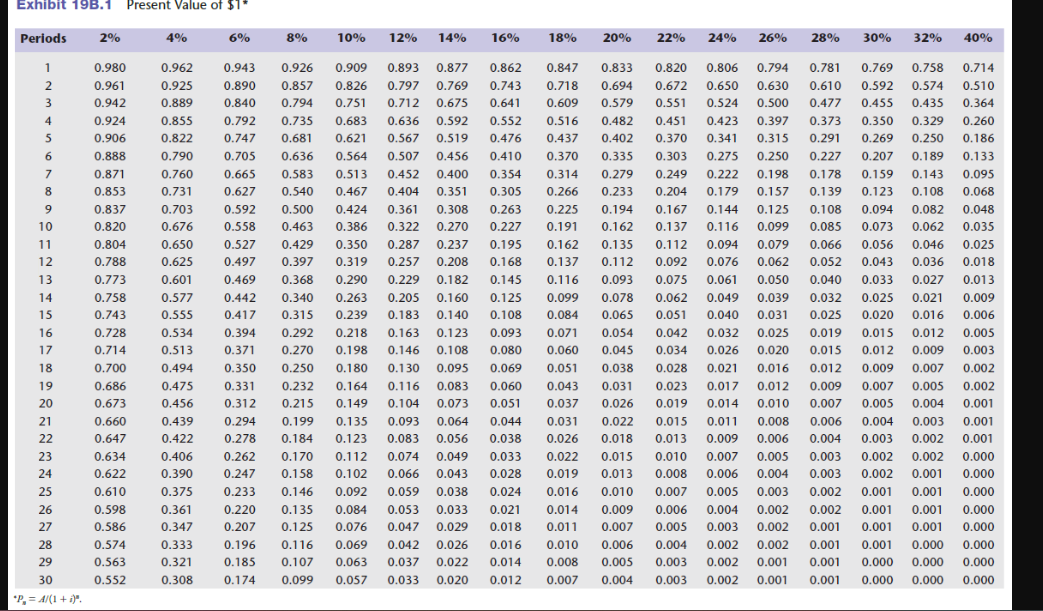
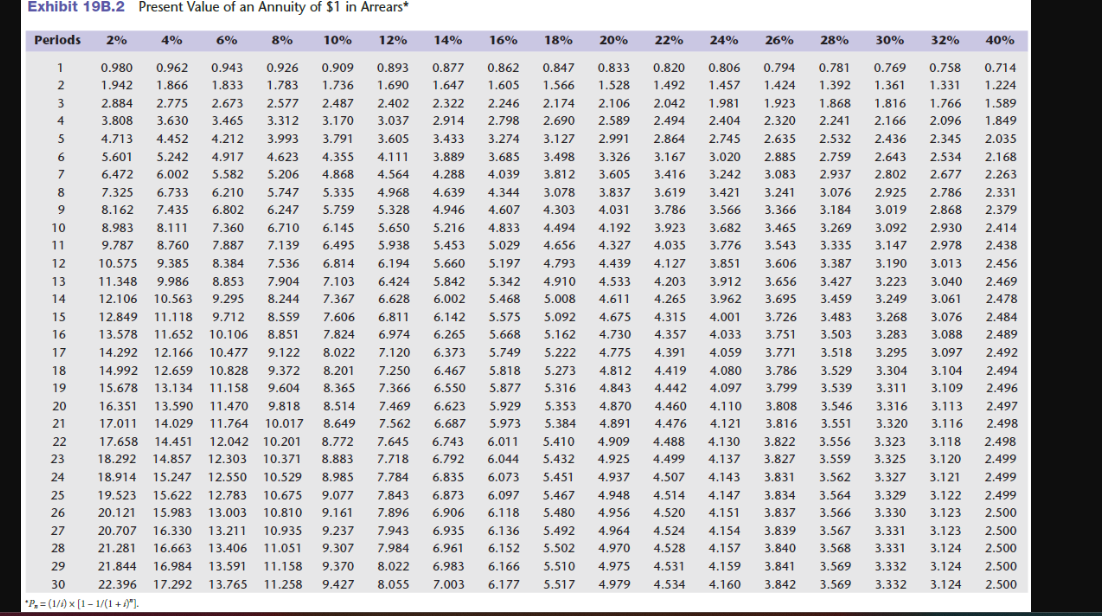
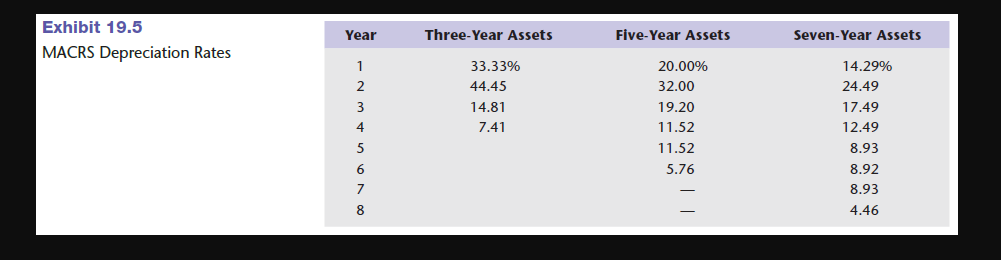
Exhibit 19B.1 Present Value of $1* Periods 2% 4% 6% 8% 10% 12% 14% 16% 18% 20% 22% 24% 26% 28% 30% 32% 40% 0.980 0.962 0.943 0.926 0.909 0.893 0.877 0.862 0.847 0.833 0.820 0.806 0.794 0.781 0.769 0.758 0.714 0.961 0.925 0.890 0.857 0.826 0.797 0.769 0.743 0.718 0.694 0.672 0.650 0.630 0.610 0.592 0.574 0.510 LAWN- 0.942 0.889 0.840 0.794 0.751 0.712 0.675 0.641 0.609 0.579 0.551 0.524 0.500 0.477 0.455 0.435 0.364 0.924 0.855 0.792 0.735 0.683 0.636 0.592 0.552 0.516 0.482 0.451 0.423 0.397 0.373 0.350 0.329 0.260 0.906 0.822 0.747 0.681 0.621 0.567 0.519 0.476 0.437 0.402 0.370 0.341 0.315 0.291 0.269 0.250 0.186 6 0.888 0.790 0.705 0.636 0.564 0.507 0.456 0.410 0.370 0.335 0.303 0.275 0.250 0.227 0.207 0.189 0.133 0.871 0.760 0.665 0.583 0.513 0.452 0.400 0.354 0.314 0.279 0.249 0.222 0.198 0.178 0.159 0.143 0.095 00 9 0.853 0.731 0.627 0.540 0.467 0.404 0.351 0.305 0.266 0.233 0.204 0.179 0.157 0.139 0.123 0.108 0.068 9 0.837 0.703 0.592 0.500 0.424 0.361 0.308 0.263 0.225 0.194 0.167 0.144 0.125 0.108 0.094 0.082 0.048 10 0.820 0.676 0.558 0.463 0.386 0.322 0.270 0.227 0.191 0.162 0.137 0.116 0.099 0.085 0.073 0.062 0.035 11 0.804 0.650 0.527 0.429 0.350 0.287 0.237 0.195 0.162 0.135 0.112 0.094 0.079 0.066 0.056 0.046 0.025 12 0.788 0.625 0.497 0.397 0.319 0.257 0.208 0.168 0.137 0.112 0.092 0.076 0.062 0.052 0.043 0.036 0.018 13 0.773 0.601 0.469 0.368 0.290 0.229 0.182 0.145 0.116 0.093 0.075 0.061 0.050 0.040 0.033 0.027 0.013 14 0.758 0.577 0.442 0.340 0.263 0.205 0.160 0.125 0.099 0.078 0.062 0.049 0.039 0.032 0.025 0.021 0.009 15 0.743 0.555 0.417 0.315 0.239 0.183 0.140 0.108 0.084 0.065 0.051 0.040 0.031 0.025 0.020 0.016 0.006 16 0.728 0.534 0.394 0.292 0.218 0.163 0.123 0.093 0.071 0.054 0.042 0.032 0.025 0.019 0.015 0.012 0.005 17 0.714 0.513 0.371 0.270 0.198 0.146 0.108 0.080 0.060 0.045 0.034 0.026 0.020 0.015 0.012 0.009 0.003 18 0.700 0.494 0.350 0.250 0.180 0.130 0.095 0.069 0.051 0.038 0.028 0.021 0.016 0.012 0.009 0.007 0.002 19 0.686 0.475 0.331 0.232 0.164 0.116 0.083 0.060 0.043 0.031 0.023 0.017 0.012 0.009 0.007 0.005 0.002 20 0.673 0.456 0.312 0.215 0.149 0.104 0.073 0.051 0.037 0.026 0.019 0.014 0.010 0.007 0.005 0.004 0.001 21 0.660 0.439 0.294 0.199 0.135 0.093 0.064 0.044 0.031 0.022 0.015 0.011 0.008 0.006 0.004 0.003 0.001 22 0.647 0.422 0.278 0.184 0.123 0.083 0.056 0.038 0.026 0.018 0.013 0.009 0.006 0.004 0.003 0.002 0.001 23 0.634 0.406 0.262 0.170 0.112 0.074 0.049 0.033 0.022 0.015 0.010 0.007 0.005 0.003 0.002 0.002 0.000 24 0.622 0.390 0.247 0.158 0.102 0.066 0.043 0.028 0.019 0.013 0.008 0.006 0.004 0.003 0.002 0.001 0.000 25 0.610 0.375 0.233 0.146 0.092 0.059 0.038 0.024 0.016 0.010 0.007 0.005 0.003 0.002 0.001 0.001 0.000 26 0.598 0.361 0.220 0.135 0.084 0.053 0.033 0.021 0.014 0.009 0.006 0.004 0.002 0.002 0.001 0.001 0.000 27 0.586 0.347 0.207 0.125 0.076 0.047 0.029 0.018 0.011 0.007 0.005 0.003 0.002 0.001 0.001 0.001 0.000 28 0.574 0.333 0.196 0.116 0.069 0.042 0.026 0.016 0.010 0.006 0.004 0.002 0.002 0.001 0.001 0.000 0.000 29 0.563 0.321 0.185 0.107 0.063 0.037 0.022 0.014 0.008 0.005 0.003 0.002 0.001 0.001 0.000 0.000 0.000 30 0.552 0.308 0.174 0.099 0.057 0.033 0.020 0.012 0.007 0.004 0.003 0.002 0.001 0.001 0.000 0.000 0.000Exhibit 19B.2 Present Value of an Annuity of $1 in Arrears* Periods 2% 4% 6% 8% 10% 12% 14% 16% 18% 20% 22% 24% 26% 28% 30% 32% 40% 0.980 0.962 0.943 0.926 0.909 0.893 0.877 0.862 0.847 0.833 0.820 0.806 0.794 0.781 0.769 0.758 0.714 N - 1.942 1.866 1.833 1.783 1.736 1.690 1.647 1.605 1.566 1.528 1.492 1.457 1.424 1.392 1.361 1.331 1.224 2.884 2.775 2.673 2.577 2.487 2.402 2.322 2.246 2.174 2.106 2.042 1.981 1.923 1.868 1.816 1.766 1.589 3.808 3.630 3.465 3.312 3.170 3.037 2.914 2.798 2.690 2.589 2.494 2.404 2.320 2.241 2.166 2.096 1.849 4.713 4.452 4.212 3.993 3.791 3.605 3.433 3.274 3.127 2.991 2.864 2.745 2.635 2.532 2.436 2.345 2.035 6 5.601 5.242 4.917 4.623 4.355 4.111 3.889 3.685 3.498 3.326 3.167 3.020 2.885 2.759 2.643 2.534 2.168 6.472 6.002 5.582 5.206 4.868 4.564 4.288 4.039 3.812 3.605 3.416 3.242 3.083 2.937 2.802 2.677 2.263 7.325 6.733 6.210 5.747 5.335 4.968 4.639 4.344 3.078 3.837 3.619 3.421 3.241 3.076 2.925 2.786 2.331 9 8.162 7.435 6.802 6.247 5.759 5.328 4.946 4.607 4.303 4.031 3.786 3.566 3.366 3.184 3.019 2.868 2.379 10 8.983 8.111 7.360 6.710 6.145 5.650 5.216 4.833 4.494 4.192 3.923 3.682 3.465 3.269 3.092 2.930 2.414 11 9.787 8.760 7.887 7.139 6.495 5.938 5.453 5.029 4.656 4.327 4.035 3.776 3.543 3.335 3.147 2.978 2.438 12 10.575 9.385 8.384 7.536 6.814 6.194 5.660 5.197 4.793 4.439 4.127 3.851 3.606 3.387 3.190 3.013 2.456 13 11.348 9.986 8.853 7.904 7.103 6.424 5.842 5.342 4.910 4.533 4.203 3.912 3.656 3.427 3.223 3.040 2.469 14 12.106 10.563 9.295 8.244 7.367 6.628 6.002 5.468 5.008 4.611 4.265 3.962 3.695 3.459 3.249 3.061 2.478 15 12.849 11.118 9.712 8.559 7.606 6.811 6.142 5.575 5.092 4.675 4.315 4.001 3.726 3.483 3.268 3.076 2.484 16 13.578 11.652 10.106 8.851 7.824 6.974 6.265 5.668 5.162 4.730 4.357 4.033 3.751 3.503 3.283 3.088 2.489 17 14.292 12.166 10.477 9.122 8.022 7.120 6.373 5.749 5.222 4.775 4.391 4.059 3.771 3.518 3.295 3.097 2.492 18 14.992 12.659 10.828 9.372 8.201 7.250 6.467 5.818 5.273 4.812 4.419 4.080 3.786 3.529 3.304 3.104 2.494 19 15.678 13.134 11.158 9.604 8.365 7.366 6.550 5.877 5.316 4.843 4.442 4.097 3.799 3.539 3.311 3.109 2.496 20 16.351 13.590 11.470 9.818 8.514 7.469 6.623 5.929 5.353 4.870 4.460 4.110 3.808 3.546 3.316 3.113 2.497 21 17.011 14.029 11.764 10.017 8.649 7.562 6.687 5.973 5.384 4.891 4.476 4.121 3.816 3.551 3.320 3.116 2.498 22 17.658 14.451 12.042 10.201 8.772 7.645 6.743 6.011 5.410 4.909 4.488 4.130 3.822 3.556 3.323 3.118 2.498 23 18.292 14.857 12.303 10.371 8.883 7.718 6.792 6.044 5.432 4.925 4.499 4.137 3.827 3.559 3.325 3.120 2.499 24 18.914 15.247 12.550 10.529 8.985 7.784 6.835 6.073 5.451 4.937 4.507 4.143 3.831 3.562 3.327 3.121 2.499 25 19.523 15.622 12.783 10.675 9.077 7.843 6.873 6.097 5.467 4.948 4.514 4.147 3.834 3.564 3.329 3.122 2.499 26 20.121 15.983 13.003 10.810 9.161 7.896 6.906 6.118 5.480 4.956 4.520 4.151 3.837 3.566 3.330 3.123 2.500 27 20.707 16.330 13.211 10.935 9.237 7.943 6.935 6.136 5.492 4.964 4.524 4.154 3.839 3.567 3.331 3.123 2.500 28 21.281 16.663 13.406 11.051 9.307 7.984 6.961 6.152 5.502 4.970 4.528 4.157 3.840 3.568 3.331 3.124 2.500 29 21.844 16.984 13.591 11.158 9.370 8.022 6.983 6.166 5.510 4.975 4.531 4.159 3.841 3.569 3.332 3.124 2.500 30 22.396 17.292 13.765 11.258 9.427 8.055 7.003 6.177 5.517 4.979 4.534 4.160 3.842 3.569 3.332 3.124 2.500 "P. = (1/0) * [1 - 1/(1 +4)].Exhibit 19.5 Year Three-Year Assets Five-Year Assets Seven-Year Assets MACRS Depreciation Rates 33.33% 20.00% 14.29% 44.45 32.00 24.49 14.81 19.20 17.49 7.41 11.52 12.49 DO YOUAWN- 11.52 8.93 5.76 8.92 8.93 4.46
Step by Step Solution
There are 3 Steps involved in it

Get step-by-step solutions from verified subject matter experts