

Question: Question: Copy and paste each univariate graphs and descriptive tables under each variable listed below. Then describe trends, patterns and exceptions depicted in each graph
Question: Copy and paste each univariate graphs and descriptive tables under each variable listed below. Then describe trends, patterns and exceptions depicted in each graph and/or table.
I'm not sure what does mean univariate graphs and exceptions for the graph. there are 5 variables
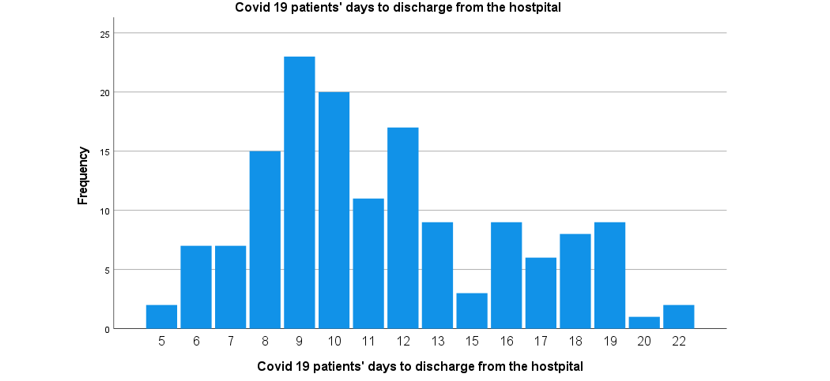
Covid 19 patients' days to discharge from the hostpital 25 20 15 Frequency 10 S 5 6 7 8 9 10 11 12 13 15 16 17 18 19 20 22 Covid 19 patients' days to discharge from the hostpital
Step by Step Solution
There are 3 Steps involved in it
1 Expert Approved Answer
Step: 1 Unlock

Question Has Been Solved by an Expert!
Get step-by-step solutions from verified subject matter experts
Step: 2 Unlock
Step: 3 Unlock