

Question: Question: Develop a control chart for the mean and range for the available toothpaste data. (Round answers to 4 decimals, e.g. 15.2501) X-Bar chart: CL=
Question: Develop a control chart for the mean and range for the available toothpaste data. (Round answers to 4 decimals, e.g. 15.2501)
X-Bar chart:
CL= ?
UCL= ?
LCL= ?
and
R-chart:
CL =?
UCL =?
LCL=?
Please help me solve, thank you in advance :)
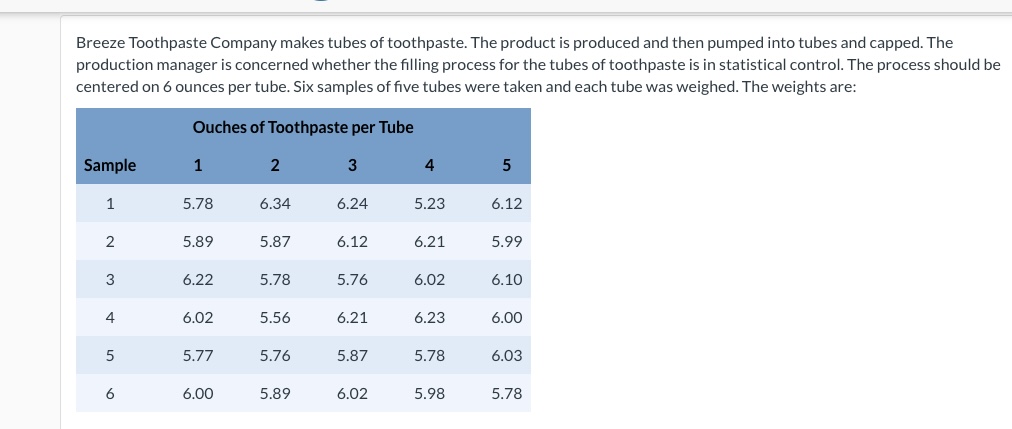
Breeze Toothpaste Company makes tubes of toothpaste. The product is produced and then pumped into tubes and capped. The production manager is concerned whether the filling process for the tubes of toothpaste is in statistical control. The process should be centered on 6 ounces per tube. Six samples of five tubes were taken and each tube was weighed. The weights are
Step by Step Solution
There are 3 Steps involved in it
1 Expert Approved Answer
Step: 1 Unlock

Question Has Been Solved by an Expert!
Get step-by-step solutions from verified subject matter experts
Step: 2 Unlock
Step: 3 Unlock