

Question: Question: Draw a network flow representation of this problem. Please do not solve the actual question, I have that part completed. Just need help with
Question: Draw a network flow representation of this problem. Please do not solve the actual question, I have that part completed. Just need help with the network flow representation.
Question: Draw a network flow representation of this problem.
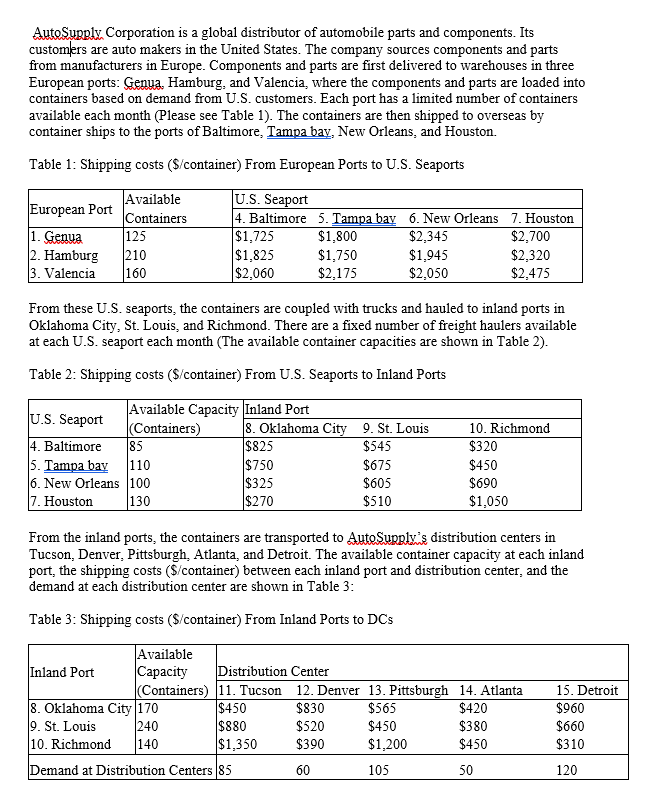
AutoSupply Corporation is a global distributor of automobile parts and components. Its customers are auto makers in the United States. The company sources components and parts from manufacturers in Europe. Components and parts are first delivered to warehouses in three European ports: Genua, Hamburg, and Valencia, where the components and parts are loaded into containers based on demand from U.S. customers. Each port has a limited number of containers available each month (Please see Table 1). The containers are then shipped to overseas by container ships to the ports of Baltimore, Tampa bay, New Orleans, and Houston. Table 1: Shipping costs (\$/container) From European Ports to U.S. Seaports From these U.S. seaports, the containers are coupled with trucks and hauled to inland ports in Oklahoma City, St. Louis, and Richmond. There are a fixed number of freight haulers available at each U.S. seaport each month (The available container capacities are shown in Table 2). Table 2: Shipping costs (\$/container) From U.S. Seaports to Inland Ports From the inland ports, the containers are transported to AutoSupply's distribution centers in Tucson, Denver, Pittsburgh, Atlanta, and Detroit. The available container capacity at each inland port, the shipping costs (\$/container) between each inland port and distribution center, and the demand at each distribution center are shown in Table 3 : Table 3: Shipping costs (\$/container) From Inland Ports to DCsStep by Step Solution
There are 3 Steps involved in it
1 Expert Approved Answer
Step: 1 Unlock

Question Has Been Solved by an Expert!
Get step-by-step solutions from verified subject matter experts
Step: 2 Unlock
Step: 3 Unlock