

Question: Question E A researcher has data fer the year seas frees the US Natienal lengitudina] Survey ef Tenth en the fellewing characteristics ef the respdedents:
![the US Natienal lengitudina] Survey ef Tenth en the fellewing characteristics ef](https://dsd5zvtm8ll6.cloudfront.net/si.experts.images/questions/2024/10/67091409c369d_20167091409a3780.jpg)
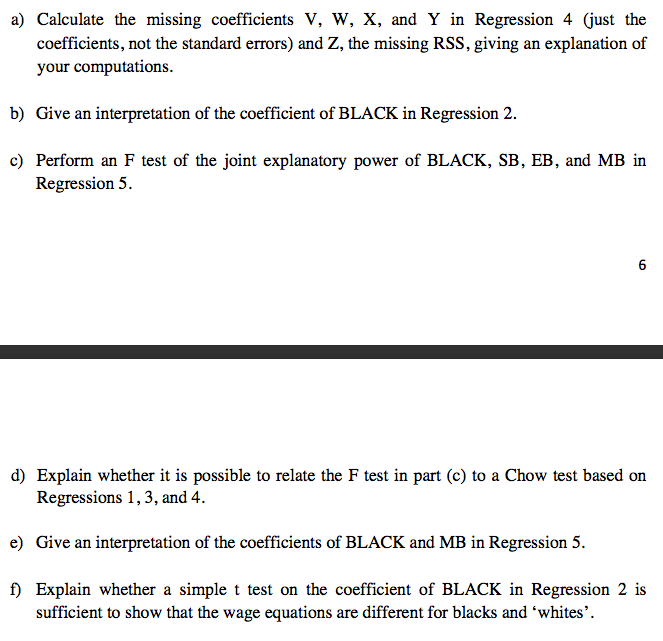
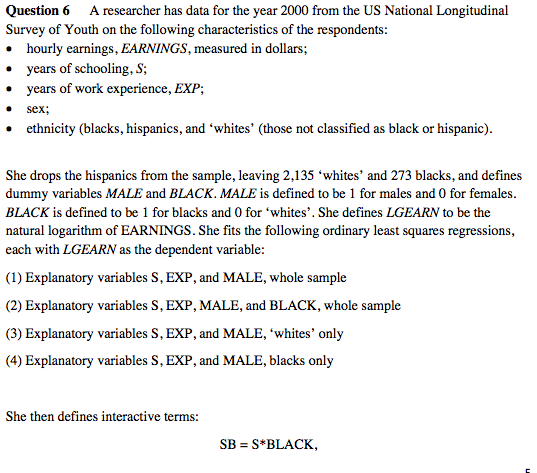
Question E A researcher has data fer the year seas frees the US Natienal lengitudina] Survey ef Tenth en the fellewing characteristics ef the respdedents: thJl'ljt earnings, WINGS, measured in dollars; years Df seheeling, S; years ef werlt experienee, EXP; 531; ethnicity {blaelts, hispanies, and 'tvhites* (these net. classied as blael-t er hispanie}. She dreps the hispanies item the sample, leaving 1,135 'tvhites' and HS blaelts, and denes dummy variables MALE andBLthE. M is denedte be 1 for males and for females. BLdCE is dened te- be 1 fer blaelrs and fer 'whites'. She denes mm to he the natural logarithm ef WES. She ts the fallew'tng erdinarv least squares regressians, each with LEW as the dependent variable: (1}E1planaterjr variables S, EXP, and W, whele sample {2} Esplanaterv variables S, EXP, MALE, and BLACK, whale sample (3}E1planater5r variables S, EXP, and W, 'whites' en]? (4} Explanation? variables S, EXP, and W, blaelts en]? She then denes interactive terms: SE = S'EIAIEK, EB = EXP*BLACK. MB = MAIE*BIAEIK, and runs a fi regression, still with LGEARN as the dependent variable: (5) E::I:];1rlanatra'_',ar variables 3. EXP, MADE. BIACK, SB, EB, MB, 1whole sample. The results are shown in the table. Unfortunately some of lose for Regression 4 are missing from the table. RSS = residual sum of squares. Standard errors are given in parentheses. .-E-: \"m NM) [9W4] W] H.033 9:532 ---- oars \" m 41.144 [(1332] 0.390 a 459 0.41] rows) to ore] [ems] mm mm 555 F s . :3 E '3 I I re .w 23. dig a) Calculate the missing coefcients V, W, X, and Y in Regression 4 (just the coefficients, not the standard errors} and Z, the missing RSS , giving an explanation of your computations. h} Give an interpretation of the coefcient of BLACK in Regression 2. c} Perform an F test of the joint explanatory power of BLACK, SB, EB, and MB in Regression 5. d) Explain whether it is possible to relate the F test in part (c) to a Chow test based on Regressions 1, 3, and 4. e} Give an interpretation of the coefcients of BLACK and MB in Regression 5. f} Explain whether a simple t test on the coefcient of BLACK in Regression 2 is sufficient to show that the wage equations are different for blacks and 'whites
Step by Step Solution
There are 3 Steps involved in it

Get step-by-step solutions from verified subject matter experts