

Question: Question E confidence interval Question 4) The following is information about the number of hour freshman nursing student studies and the grade that they receive
Question E confidence interval
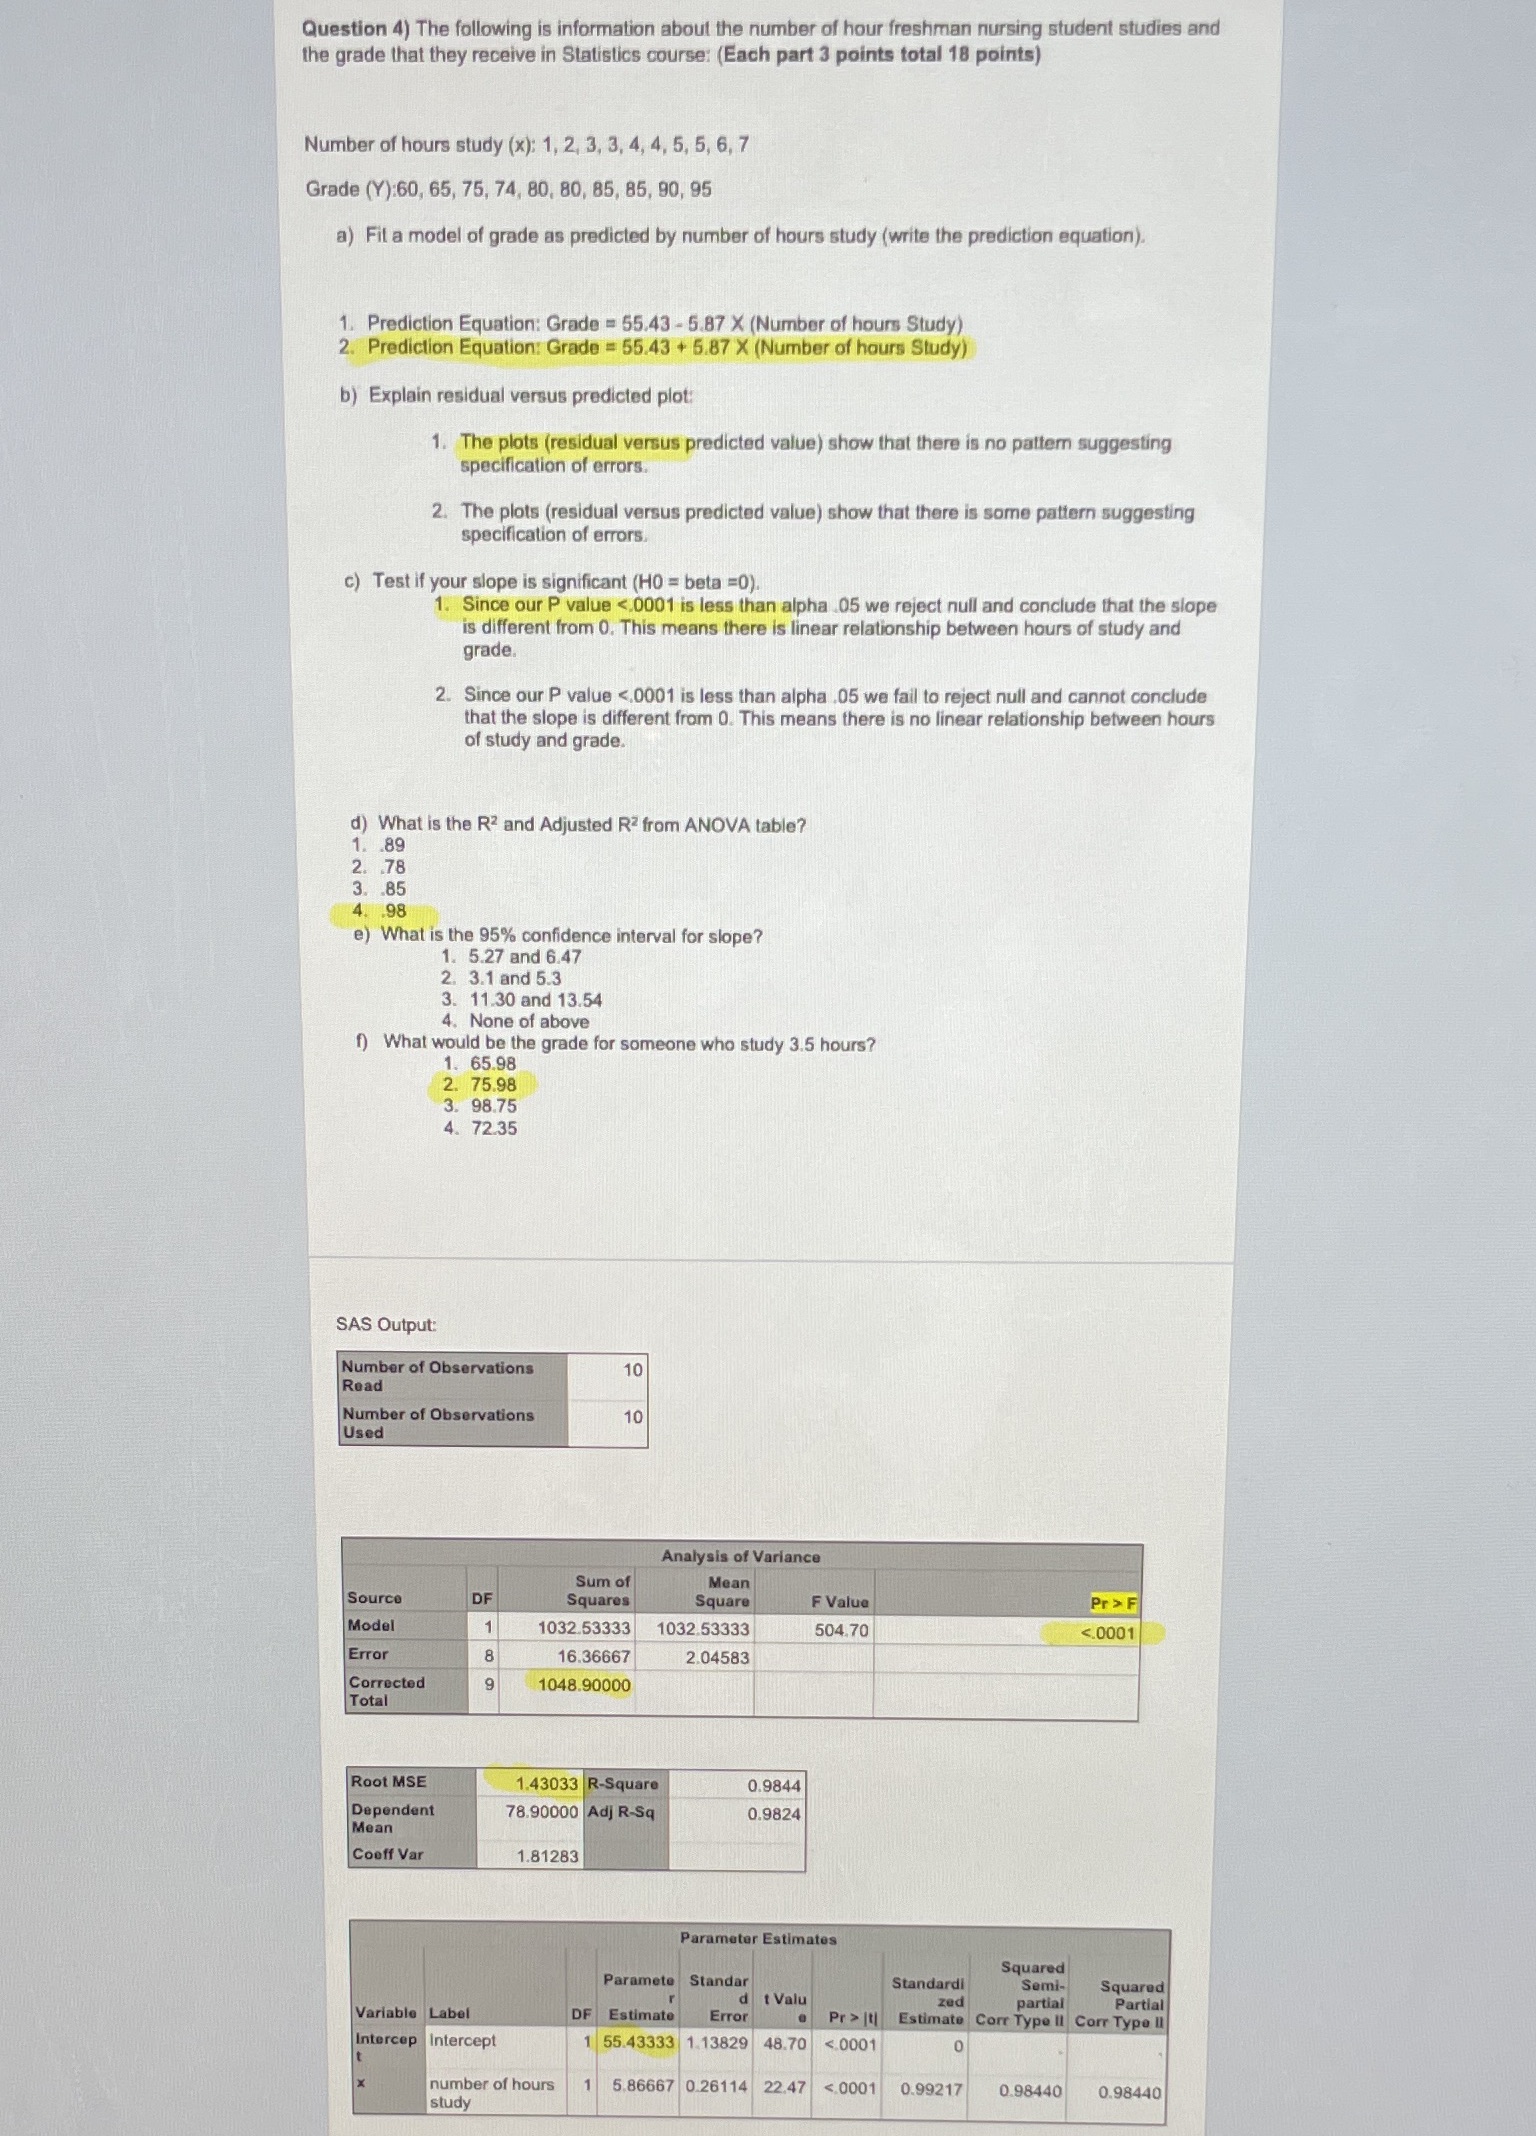
Question 4) The following is information about the number of hour freshman nursing student studies and the grade that they receive in Statistics course: (Each part 3 points total 18 points) Number of hours study (x): 1, 2, 3, 3, 4, 4, 5, 5, 6, 7 Grade (Y):60, 65, 75, 74, 80, 80, 85, 85, 90, 95 a) Fil a model of grade as predicted by number of hours study (write the prediction equation). 1. Prediction Equation: Grade = 55.43 - 5.87 X (Number of hours Study) 2. Prediction Equation: Grade = 55.43 + 5.87 X (Number of hours Study) b) Explain residual versus predicted plot: 1. The plots (residual versus predicted value) show that there is no pattern suggesting specification of errors. 2. The plots (residual versus predicted value) show that there is some pattern suggesting specification of errors. c) Test if your slope is significant (HO = beta =0). 1. Since our P value <.0001 is less than alpha .05 we reject null and conclude that the slope different from this means there linear relationship between hours of study grade. since our p value fail to cannot no d what r2 adjusted anova table .78 .98 e confidence interval for none above f would be grade someone who sas output: number observations read used analysis variance sum mean source df squares square pr> F Model 1032.53333 1032.53333 504.70 <.0001 error corrected total root mse r-square dependent adj r-sq mean cooff var parameter estimates squared parameterandar standard semi- d t valu zed partial variable label df estimate pr> |t| Estimate Corr Type ll Corr Type II Intercep Intercept 55.43333 1.13829 48.70 <.0001 number of hours study>
Step by Step Solution
There are 3 Steps involved in it

Get step-by-step solutions from verified subject matter experts