

Question: Question: Estimate three simple linear regression models that use compensation as the response variable with return on assets (ROA), return on equity (ROE), or Total
Question: Estimate three simple linear regression models that use compensation as the response variable with return on assets (ROA), return on equity (ROE), or Total Assets as the explanatory variable. Which model do you select?
Model 1: ExecComp=beta0+beta1timesROA+uiExecComp=beta0+beta1timesROA+ui
Model 2: ExecComp=beta0+beta1timesROE+uiExecComp=beta0+beta1timesROE+ui
Model 3: ExecComp=beta0+beta1timesTotalAssets+uiExecComp=beta0+beta1timesTotalAssets+ui
|
Since Model 1 has the highest SER and the lowest R2R2, Model 1 is the best model specification. | ||
|
Since Model 2 has the lowest SER and the lowest R2R2, Model 2 is the best model specification. | ||
|
Since Model 3 has the lowest SER and the highest R2R2, Model 3 is the best model specification. | ||
|
Since Model 1 has the highest SER and the highest R2R2, Model 1 is the best model specification. | ||
|
Since Model 2 has the lowest SER and the highest R2R2, Model 2 is the best model specification. |
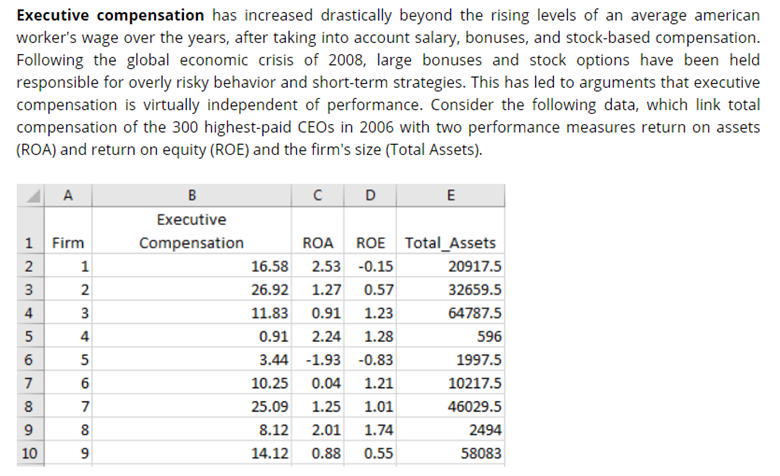
Executive compensation has increased drastically beyond the rising levels of an average american worker's wage over the years, after taking into account salary, bonuses, and stock-based compensation. Following the global economic crisis of 2008, large bonuses and stock options have been held responsible for overly risky behavior and short-term strategies. This has led to arguments that executive compensation is virtually independent of performance. Consider the following data, which link total compensation of the 300 highest-paid CEOs in 2006 with two performance measures return on assets (ROA) and return on equity (ROE) and the firm's size (Total Assets). A 3 2 3 1 Firm 2. 1 3 2 4 3 5 4 6 5 7 6 8 7 9 8 10 9 B D E Executive Compensation ROA ROE Total_Assets 16.58 2.53 -0.15 20917.5 26.92 1.27 0.57 32659.5 11.83 0.91 1.23 64787.5 0.91 2.24 1.28 596 3.44 -1.93 -0.83 1997.5 10.25 0.04 1.21 10217.5 25.09 1.25 1.01 46029.5 8.12 2.01 1.74 2494 14.12 0.88 0.55 58083 9 8 9 Executive compensation has increased drastically beyond the rising levels of an average american worker's wage over the years, after taking into account salary, bonuses, and stock-based compensation. Following the global economic crisis of 2008, large bonuses and stock options have been held responsible for overly risky behavior and short-term strategies. This has led to arguments that executive compensation is virtually independent of performance. Consider the following data, which link total compensation of the 300 highest-paid CEOs in 2006 with two performance measures return on assets (ROA) and return on equity (ROE) and the firm's size (Total Assets). A 3 2 3 1 Firm 2. 1 3 2 4 3 5 4 6 5 7 6 8 7 9 8 10 9 B D E Executive Compensation ROA ROE Total_Assets 16.58 2.53 -0.15 20917.5 26.92 1.27 0.57 32659.5 11.83 0.91 1.23 64787.5 0.91 2.24 1.28 596 3.44 -1.93 -0.83 1997.5 10.25 0.04 1.21 10217.5 25.09 1.25 1.01 46029.5 8.12 2.01 1.74 2494 14.12 0.88 0.55 58083 9 8 9
Step by Step Solution
There are 3 Steps involved in it

Get step-by-step solutions from verified subject matter experts