

Question: Question: explore the relationship between financial analysis and strategic analysis in a review of the case study Kering SA: Probing the Performance Gap with LVMH
Question:explore the relationship between financial analysis and strategic analysis in a review of the case studyKering SA: Probing the Performance Gap with LVMH(Case #2 from your textbook). Read: Chapter 2, "Putting Performance Analysis into Practice."
- How well is Kering performing relative to LVMH?
- From (a) the financial data and (b) what we know about Kering's businesses, can we identify the sources of Kering's inferior performance?
- How are the shareholders and stakeholders affected by the performance?
- What can Kering's management do to close the gap with LVMH?
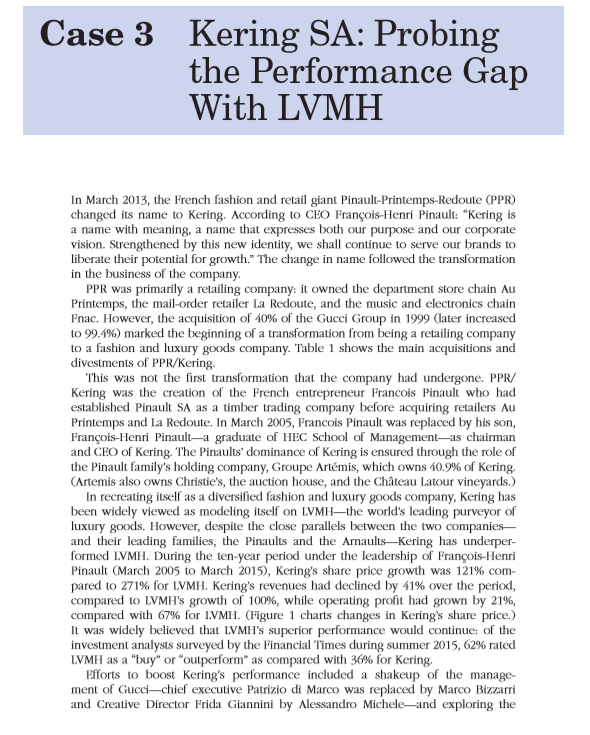
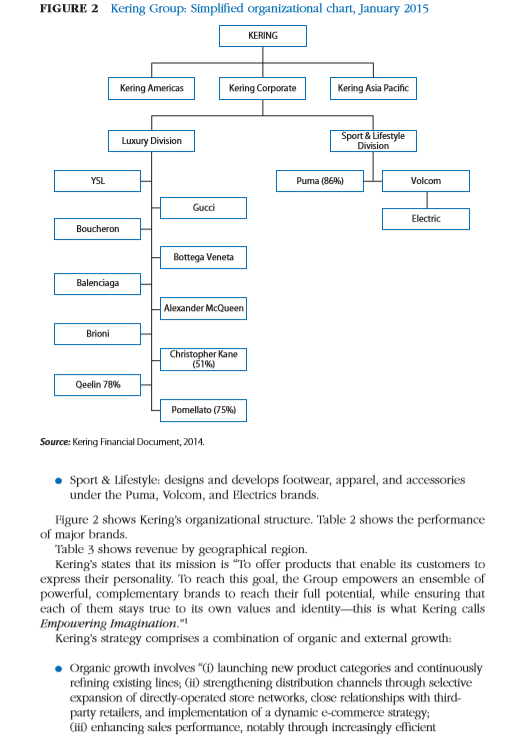
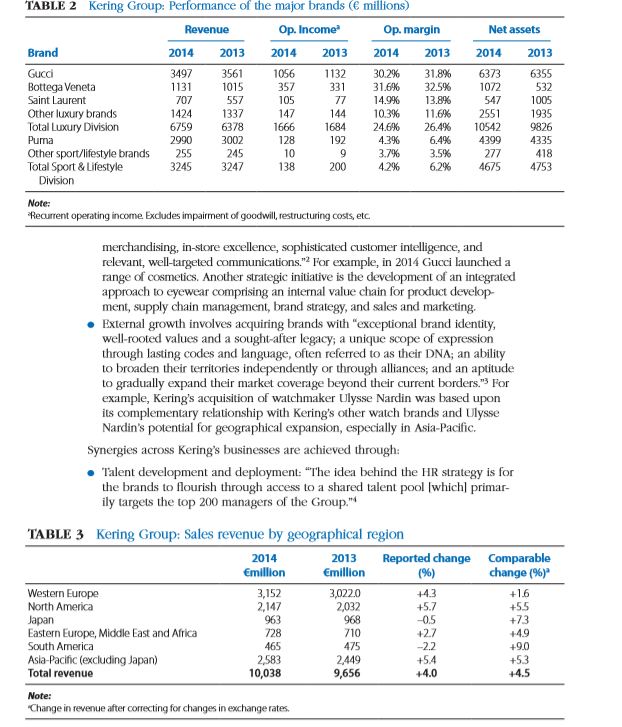
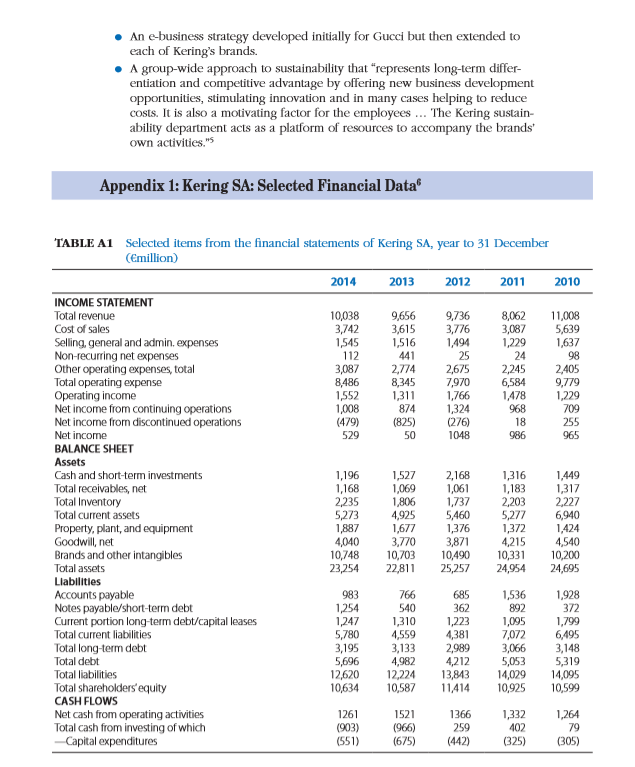
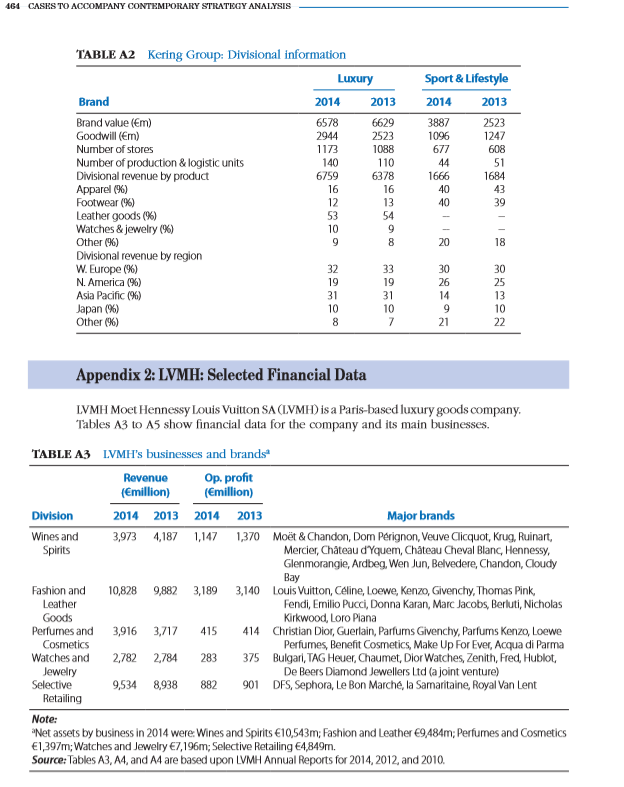
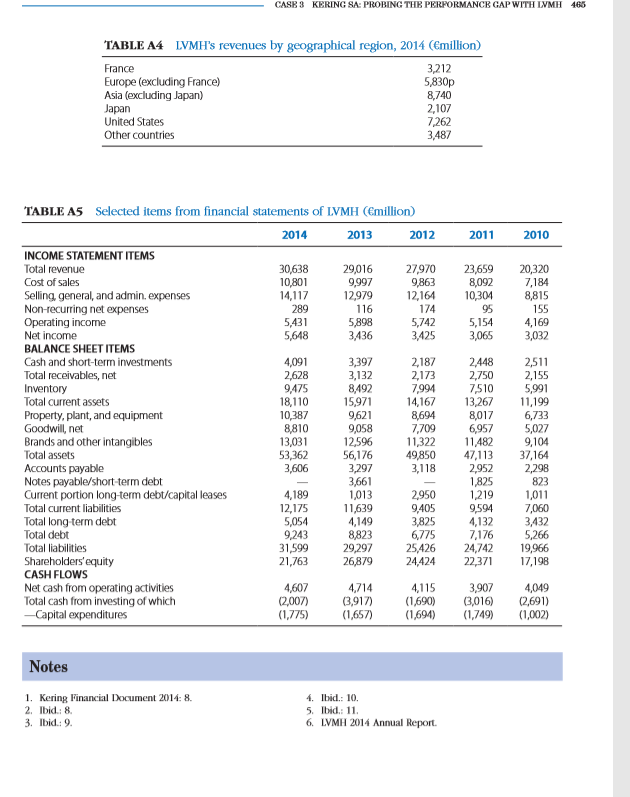
Case 3 Kering SA: Probing the Performance Gap With LVMH In March 2013, the French fashion and retail giant Pinault-Printemps-Redoute (PPR) changed its name to Kering. According to CEO Francois-Henri Pinault: "Kering is a name with meaning, a name that expresses both our purpose and our corporate vision. Strengthened by this new identity, we shall continue to serve our brands to liberate their potential for growth." The change in name followed the transformation in the business of the company. PPR was primarily a retailing company: it owned the department store chain Au Printemps, the mail-order retailer La Redoute, and the music and electronics chain Pnac. However, the acquisition of 40% of the Gucci Group in 1999 (later increased to 99.4%) marked the beginning of a transformation from being a retailing company to a fashion and luxury goods company. Table 1 shows the main acquisitions and divestments of PPR/Kering This was not the first transformation that the company had undergone. PPR/ Kering was the creation of the French entrepreneur Francois Pinault who had established Pinault SA as a timber trading company before acquiring retailers Au Printemps and La Redoute, In March 2005, Francois Pinault was replaced by his son, Francois-Henri Pinault-a graduate of HEC School of Management-as chairman and CEO of Kering. The Pinaults' dominance of Kering is ensured through the role of the Pinault family's holding company, Groupe Artemis, which owns 40.9% of Kering (Artemis also owns Christie's, the auction house, and the Chateau Latour vineyards.) In recreating itself as a diversified fashion and luxury goods company, Kering has been widely viewed as modeling itself on LVMH-the world's leading purveyor of luxury goods. However, despite the close parallels between the two companies- and their leading families, the Pinaults and the Arnaults-Kering has underper- formed LVMH. During the ten-year period under the leadership of Francois-Henri Pinault (March 2005 to March 2015), Kering's share price growth was 121% com- pared to 271% for LVMH. Kering's revenues had declined by 41% over the period, compared to LVMH's growth of 100%, while operating profit had grown by 21%, compared with 67% for LVMH. (Figure 1 charts changes in Kering's share price.) It was widely believed that LVMH's superior performance would continue: of the investment analysts surveyed by the Financial Times during summer 2015, 62% rated LVMH as a "buy" or "outperform" as compared with 36% for Kering. Efforts to boost Kering's performance included a shakeup of the manage- ment of Guel-chief executive Patrizio di Marco was replaced by Marco Bizzarri and Creative Director Frida Giannini by Alessandro Michele-and exploring theFIGURE 2 Kering Group: Simplified organizational chart, January 2015 KERING Kering Americas Kering Corporate Kering Asia Pacific Luxury Division Sport & Lifestyle Division YSL Puma (86%) Volcom Gucci Electric Boucheron Bottega Veneta Balenciaga Alexander Mcqueen Brioni Christopher Kane (516) Qeelin 78% Pomellato (75%) Source: Kering Financial Document, 2014. . Sport & Lifestyle: designs and develops footwear, apparel, and accessories under the Puma, Volcom, and Electrics brands. Figure 2 shows Kering's organizational structure. Table 2 shows the performance of major brands. Table 3 shows revenue by geographical region. Kering's states that its mission is "To offer products that enable its customers to express their personality. To reach this goal, the Group empowers an ensemble of powerful, complementary brands to reach their full potential, while ensuring that each of them stays true to its own values and identity-this is what Kering calls Empowering Imagination." Kering's strategy comprises a combination of organic and external growth: . Organic growth involves "(1) launching new product categories and continuously refining existing lines; (ii) strengthening distribution channels through selective expansion of directly-operated store networks, close relationships with third- party retailers, and implementation of a dynamic e-commerce strategy; (iiD) enhancing sales performance, notably through increasingly efficientTABLE 2 Kering Group: Performance of the major brands ($ millions) Revenue Op. Income Op. margin Net assets Brand 2014 2013 2014 2013 2014 2013 2014 2013 Gucd 3497 3561 1056 1132 30.2% 31.8% 6373 6355 Bottega Veneta 1131 1015 357 331 31.6% 32.5% 1072 532 Saint Laurent 707 557 105 77 14.9% 13.8% 547 1005 Other luxury brands 1424 1337 147 144 10.3% 11.6% 2551 1935 Total Luxury Division 6759 6378 1666 1684 24.6% 26.4% 10542 9826 Puma 2990 3002 128 192 4.3% 6.4% 4399 4335 Other sport/lifestyle brands 255 245 10 9 3.7% 3.5% 277 418 Total Sport & Lifestyle 3245 3247 138 200 4.2 6.2% 4675 4753 Division Note: Recurrent operating income Excludes impairment of goodwill, restructuring costs, etc merchandising, in-store excellence, sophisticated customer intelligence, and relevant, well-targeted communications." For example, in 2014 Gucci launched a range of cosmetics. Another strategic initiative is the development of an integrated approach to eyewear comprising an internal value chain for product develop- ment, supply chain management, brand strategy, and sales and marketing. . External growth involves acquiring brands with "exceptional brand identity, well-rooted values and a sought-after legacy; a unique scope of expression through lasting codes and language, often referred to as their DNA; an ability to broaden their territories independently or through alliances; and an aptitude to gradually expand their market coverage beyond their current borders." For example, Kering's acquisition of watchmaker Ulysse Nardin was based upon its complementary relationship with Kering's other watch brands and Ulysse Nardin's potential for geographical expansion, especially in Asia-Pacific. Synergies across Kering's businesses are achieved through: . Talent development and deployment: "The idea behind the HR strategy is for the brands to flourish through access to a shared talent pool (which] primar ily targets the top 200 managers of the Group." TABLE 3 Kering Group: Sales revenue by geographical region 2014 2013 Reported change Comparable Emillion Emillion (6) change (%)* Western Europe 3,152 3,022.0 +4.3 +1.6 North America 2,147 2.032 +5.7 +5.5 Japan 963 968 05 +73 Eastern Europe, Middle East and Africa 728 710 +2.7 149 South America 465 475 -2.2 +9.0 Asia-Pacific (excluding Japan) 2.583 2449 +5.4 +53 Total revenue 10,038 9,656 +4.0 +4.5 Note: "Change in revenue after correcting for changes in exchange rates,. An e-business strategy developed initially for Gucci but then extended to each of Kering's brands. . A group-wide approach to sustainability that "represents long-term differ- entiation and competitive advantage by offering new business development opportunities, stimulating innovation and in many cases helping to reduce costs. It is also a motivating factor for the employees ... The Kering sustain- ability department acts as a platform of resources to accompany the brands' own activities."s Appendix 1: Kering SA: Selected Financial Data TABLE A1 Selected items from the financial statements of Kering SA, year to 31 December (Emillion) 2014 2013 2012 2011 2010 INCOME STATEMENT Total revenue 10,038 9,656 9,736 8,062 11,008 Cost of sales 3,742 3,615 3,776 3,087 5,639 Selling, general and admin, expenses 1,545 1,516 1,494 1,229 1,637 Non-recurring net expenses 112 441 25 24 98 Other operating expenses, total 3,087 2,774 2,675 2,245 2,405 Total operating expense 8,486 8,345 7,970 6,584 9,779 Operating income 1,552 1,311 1,766 1,478 1,229 Net income from continuing operations 1,008 874 1,324 968 709 Net income from discontinued operations (479) (825) (276 18 255 Net income 529 50 1048 986 965 BALANCE SHEET Assets Cash and short-term investments 1,196 1,527 2,168 1,316 1,449 Total receivables, net 1,168 1,069 1,061 1,183 1,317 Total Inventory 2,235 1,806 1,737 2,203 2,227 Total current assets 5,273 4,925 5,460 5,277 6,940 Property, plant, and equipment 1,887 1,677 1,376 1,372 1,424 Goodwill, net 4,040 3.770 3,871 4,215 4,540 Brands and other intangibles 10,748 10.703 10,490 10,331 10,200 Total assets 23,254 22,811 25,257 24,954 24.695 Liabilities Accounts payable 983 766 685 1,536 1,928 Notes payable/short-term debt 1,254 540 362 892 372 Current portion long-term debt/capital leases 1,247 1.310 1,223 1,095 1,799 Total current liabilities 5,780 4,559 4,381 7,072 6.495 Total long-term debt 3,195 3.133 2.989 3,066 3,148 Total debt 5.696 4.982 4,212 5.053 5.319 Total liabilities 12,620 12.224 13.843 14.029 14.095 Total shareholders'equity 10,634 10,587 11,414 10,925 10,599 CASH FLOWS Net cash from operating activities 1261 1521 1366 1,332 1.264 Total cash from investing of which (903) (966) 259 402 79 Capital expenditures (551) (675) (442 (325) (305)464 CASES TO ACCOMPANY CONTEMPORARY STRATEGY ANALYSIS TABLE A2 Kering Group: Divisional information Luxury Sport & Lifestyle Brand 2014 2013 2014 2013 Brand value (Em) 6578 6629 3887 2523 Goodwill (Em) 2944 2523 1096 1247 Number of stores 1173 1088 677 608 Number of production & logistic units 140 110 44 51 Divisional revenue by product 6759 6378 1666 1684 Apparel (96) 16 16 40 43 Footwear (96) 12 13 40 39 Leather goods (9%) 53 54 Watches & jewelry (16) 10 9 - - Other (%6) 9 20 18 Divisional revenue by region W. Europe (9%) 32 33 30 30 N. America (9%) 19 19 26 25 Asia Pacific (9%) 31 31 14 13 Japan (96) 10 10 9 10 Other (6) 21 22 Appendix 2: LVMH: Selected Financial Data LVMH Moet Hennessy Louis Vuitton SA (LVMH) is a Paris-based luxury goods company. Tables A3 to A5 show financial data for the company and its main businesses. TABLE A3 LVMH's businesses and brands Revenue Op. profit (Emillion) (Emillion) Division 2014 2013 2014 2013 Major brands Wines and 3,973 4,187 1,147 1,370 Moet & Chandon, Dom Perignon, Veuve Clicquot, Krug, Ruinart, Spirits Mercier, Chateau d'Yquem, Chateau Cheval Blanc, Hennessy, Glenmorangie, Ardbeg, Wen Jun, Belvedere, Chandon, Cloudy Bay Fashion and 10,828 9,882 3,189 3,140 Louis Vuitton, Celine, Loewe, Kenzo, Givenchy, Thomas Pink, Leather Fendi, Emilio Pucci, Donna Karan, Marc Jacobs, Berluti, Nicholas Goods Kirkwood, Loro Piana Perfumes and 3,916 3,717 415 414 Christian Dior, Guerlain, Parfums Givenchy, Parfums Kenzo, Loewe Cosmetics Perfumes, Benefit Cosmetics, Make Up For Ever, Acqua di Parma Watches and 2,782 2,784 283 375 Bulgari, TAG Heuer, Chaumet, Dior Watches, Zenith, Fred, Hublot, Jewelry De Beers Diamond Jewellers Ltd (a joint venture) Selective 9,534 8,938 882 901 DFS, Sephora, Le Bon Marche, la Samaritaine, Royal Van Lent Retailing Note: "Net assets by business in 2014 were: Wines and Spirits (10,543m; Fashion and Leather (9,484m; Perfumes and Cosmetics E1,397m; Watches and Jewelry E7,196m; Selective Retailing (4,849m. Source: Tables A3, A4, and A4 are based upon LVMH Annual Reports for 2014, 2012, and 2010.CASE 3 KERING SA PROBING THE PERFORMANCE GAP WITH LVMH 465 TABLE A4 LVMH's revenues by geographical region, 2014 (6million) France 3,212 Europe (excluding France) 5,830p Asia (excluding Japan) 8,740 Japan 2,107 United States 7,262 Other countries 3,487 TABLE A5 Selected items from financial statements of LVMH ((million) 2014 2013 2012 2011 2010 INCOME STATEMENT ITEMS Total revenue 30.638 29016 27,970 23,659 20,320 Cost of sales 10.801 9.997 9.863 8,092 7,184 Selling, general, and admin. expenses 14.117 12,979 12,164 10304 8,815 Non-recurring net expenses 289 116 174 95 155 Operating income 5,431 5,898 5,742 5,154 4,169 Net income 5,648 3.436 3.425 3,065 3,032 BALANCE SHEET ITEMS Cash and short-term investments 4,091 3,397 2,187 2,448 2,511 Total receivables, net 2.628 3,132 2,173 2,750 2,155 Inventory 9,475 8492 7,994 7510 5.991 Total current assets 18,110 15.971 14,167 13,267 11,199 Property, plant, and equipment 10 387 9.621 8.694 8.017 6,733 Goodwill, net 8.810 9.058 7,709 6.957 5,027 Brands and other intangibles 13,031 12,596 11,322 11,482 9,104 Total assets 53,362 56,176 49.850 47,113 37,164 Accounts payable 3,606 3.297 3,118 2,952 2.298 Notes payable/short-term debt 3,661 1,825 823 Current portion long-term debt/capital leases 4,189 1,013 2,950 1,219 1,011 Total current liabilities 12, 175 11.639 9.405 9594 7,060 Total long-term debt 5,054 4.149 3,825 4,132 3.432 Total debt 9.243 8823 6,775 7,176 5,266 Total liabilities 31,599 29,297 25,426 24,742 19,966 Shareholders' equity 21,763 26.879 24.424 22,371 17,198 CASH FLOWS Net cash from operating activities 4,607 4,714 4.115 3,907 4.049 Total cash from investing of which (2,007) (3,917) (1,690 (3,016) (2,691) Capital expenditures (1,775) (1,657) (1,694) (1,749) (1,002) Notes 1. Kering Financial Document 2014: 8. 4. Ibid: 10. 2. Ibid.: 8. 5. Ibid.: 11. 3. Ibid : 9. 6. LVMH 2014 Annual Report
Step by Step Solution
There are 3 Steps involved in it

Get step-by-step solutions from verified subject matter experts