

Question: Question: Financial ratios are often divided up into seven main categories: liquidity, solvency, efficiency, profitability, market prospect, investment leverage, and coverage. As a financial Analyist,
Question: Financial ratios are often divided up into seven main categories: liquidity, solvency, efficiency, profitability, market prospect, investment leverage, and coverage.
As a financial Analyist, use the Apple Financial data below to solve those rations (preferable in tabular form) and please give your advice on each ratio.
Financial Performance of Apple Inc. Company - Last Ten Years
Reference: http://financials.morningstar.com/ratios/r.html?t=AAPL®ion=usa&culture=en-US
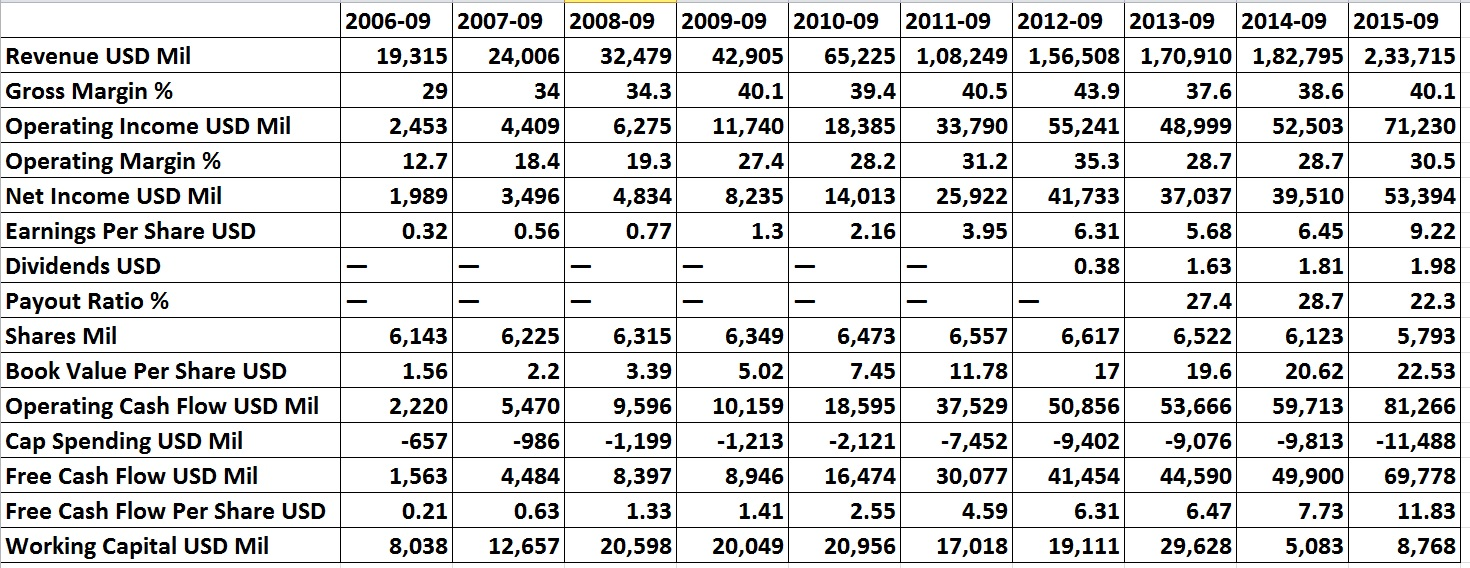
2006-09 2007-09 2008-09 2009-09 2010-09 2011-09 2012-09 2013-09 2014-09 2015-09 Revenue USD Mil Gross Margin % Operating Income USD Mil Operating Margin % Net Income USD Mil Earnings Per Share USD Dividends USD Payout Ratio % Shares Mil Book Value Per Share USD Operating Cash Flow USD Mil Cap Spending USD Mil Free Cash Flow USD Mil Free Cash Flow Per Share USD Working Capital USD Mil 19,315 24,00632,47942,90565,2251,08,2491,56,5081,70,9101,82,7952,33,715 40.1 6,27511,74018,38533,79055,24148,999 52,50371,230 30.5 8,23514,013 25,92241,73337,03739,51053,394 9.22 1.98 22.3 5,793 22.53 9,59610,15918,59537,52950,85653,666 59,71381,266 9,813-11,488 8,94616,47430,07741,45444,59049,900 69,778 11.83 8,768 34.3 40.1 39.4 40.5 43.9 37.6 38.6 2,453 12.7 1,989 0.32 4,409 18.4 3,496 0.56 19.3 4,834 0.77 27.4 28.2 31.2 35.3 28.7 28.7 3.95 5.68 1.63 27.4 6,522 19.6 6.31 1.81 28.7 6,123 20.62 0.38 6,349 5.02 6,143 1.56 2,220 657 1,563 0.21 6,315 3.39 6,557 11.78 6,225 6,473 6,617 5,470 986 4,484 0.63 7,452 -1,199 8,397 1.33 -1,213 2,121 9,402 9,076 2.55 4.59 6.31 7.73 8,03812,65720,598 20,04920,95617,01819,11129,628 5,083
Step by Step Solution
There are 3 Steps involved in it

Get step-by-step solutions from verified subject matter experts