

Question: Question Five (20 Marks): The following data have been collected for a management information system project. a) Compute the SV and CV for period 6,
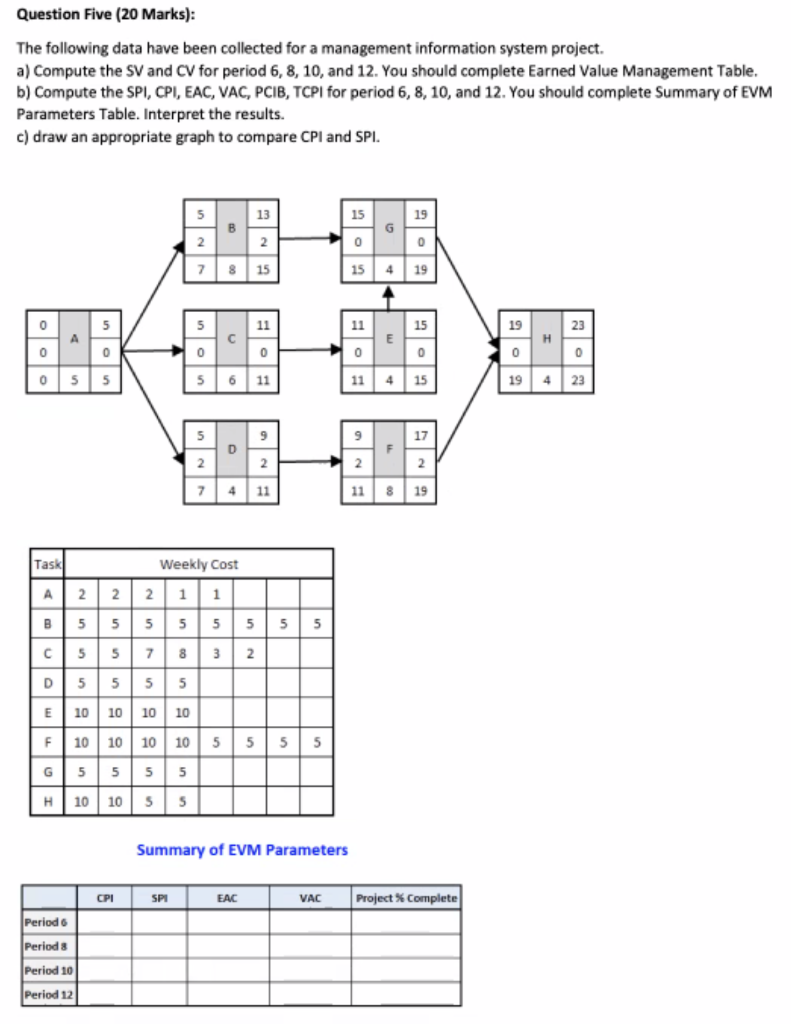
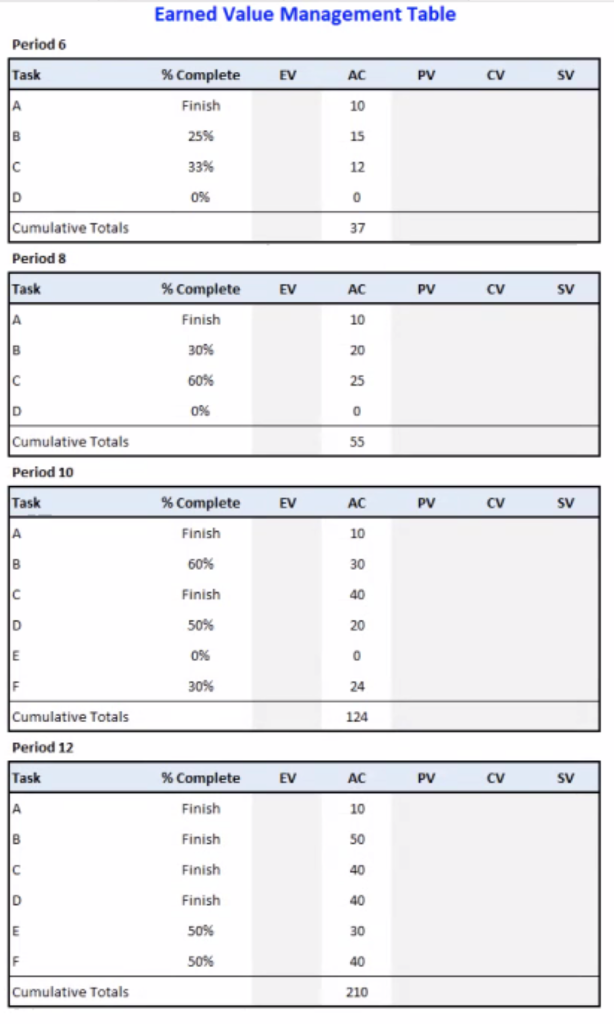
Question Five (20 Marks): The following data have been collected for a management information system project. a) Compute the SV and CV for period 6, 8, 10, and 12. You should complete Earned Value Management Table. b) Compute the SPI, CPI, EAC, VAC, PCIB, TCPI for period 6, 8, 10, and 12. You should complete Summary of EVM Parameters Table. Interpret the results. c) draw an appropriate graph to compare CPI and SPI. 5 13 15 19 B G 2 2 0 0 7 8 15 15 4 19 0 5 5 11 11 15 19 23 A E H 0 0 0 0 0 0 0 0 0 55 5 6 11 11 4 15 194 23 5 9 9 17 2 2 2 2 4 11 11 8 19 Task Weekly Cost 2 2 1 1 2 B5 55 5 555 5 D5 5 5 5 F 10 10 10 10 5 5 5 5 H 10 10 5 5 Summary of EVM Parameters CPI SPI EAC VAC Project Complete Periodo Periods Period 10 Period 12 Earned Value Management Table Period 6 Task % Complete EV AC PV CV SV A Finish 10 B 25% 15 33% 12 D 0% 0 Cumulative Totals 37 Period 8 Task % Complete EV AC PV CV SV Finish 10 B 30% 20 C 60% 25 D 0% 0 Cumulative Totals 55 Period 10 Task % Complete EV AC PV SV A Finish 10 | | 60% 30 Finish 40 D 50% 20 E 0% 0 30% 24 124 Cumulative Totals Period 12 Task % Complete EV AC PV CV SV Finish 10 B Finish 50 Finish 40 Finish 40 E 50% 30 F 50% 40 Cumulative Totals 210 Question Five (20 Marks): The following data have been collected for a management information system project. a) Compute the SV and CV for period 6, 8, 10, and 12. You should complete Earned Value Management Table. b) Compute the SPI, CPI, EAC, VAC, PCIB, TCPI for period 6, 8, 10, and 12. You should complete Summary of EVM Parameters Table. Interpret the results. c) draw an appropriate graph to compare CPI and SPI. 5 13 15 19 B G 2 2 0 0 7 8 15 15 4 19 0 5 5 11 11 15 19 23 A E H 0 0 0 0 0 0 0 0 0 55 5 6 11 11 4 15 194 23 5 9 9 17 2 2 2 2 4 11 11 8 19 Task Weekly Cost 2 2 1 1 2 B5 55 5 555 5 D5 5 5 5 F 10 10 10 10 5 5 5 5 H 10 10 5 5 Summary of EVM Parameters CPI SPI EAC VAC Project Complete Periodo Periods Period 10 Period 12 Earned Value Management Table Period 6 Task % Complete EV AC PV CV SV A Finish 10 B 25% 15 33% 12 D 0% 0 Cumulative Totals 37 Period 8 Task % Complete EV AC PV CV SV Finish 10 B 30% 20 C 60% 25 D 0% 0 Cumulative Totals 55 Period 10 Task % Complete EV AC PV SV A Finish 10 | | 60% 30 Finish 40 D 50% 20 E 0% 0 30% 24 124 Cumulative Totals Period 12 Task % Complete EV AC PV CV SV Finish 10 B Finish 50 Finish 40 Finish 40 E 50% 30 F 50% 40 Cumulative Totals 210
Step by Step Solution
There are 3 Steps involved in it

Get step-by-step solutions from verified subject matter experts