

Question: Question Given the following frequency distribution table for a set of data about the length for a single leap (in feet) for randomly sampled red
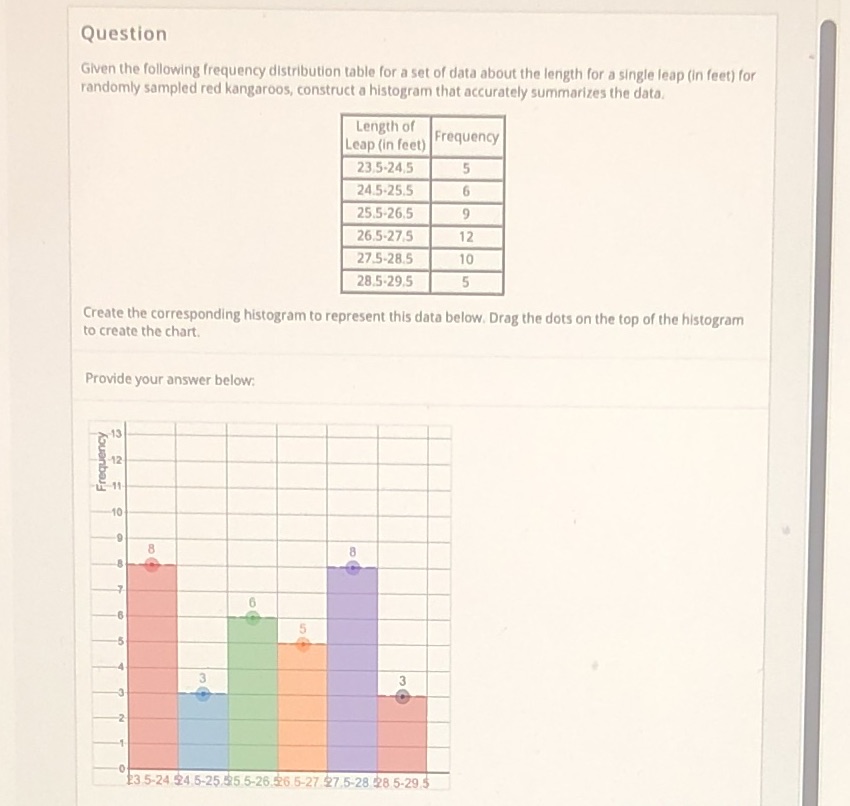
Question Given the following frequency distribution table for a set of data about the length for a single leap (in feet) for randomly sampled red kangaroos, construct a histogram that accurately summarizes the data. Length of Leap (in feet) Frequency 23.5-24.5 5 24.5-25.5 6 25.5-26.5 9 26.5-27.5 12 27.5-28.5 10 28.5-29.5 5 Create the corresponding histogram to represent this data below. Drag the dots on the top of the histogram to create the chart. Provide your answer below: Frequency 12 -10 8 6 w 13 5-24 24 5-25 5 5-26.26.5-27 27.5-28 28 5-29.5
Step by Step Solution
There are 3 Steps involved in it
1 Expert Approved Answer
Step: 1 Unlock

Question Has Been Solved by an Expert!
Get step-by-step solutions from verified subject matter experts
Step: 2 Unlock
Step: 3 Unlock