

Question: Question Help A sample of fifth-grade classes was studied in an article. One of the variables collected was the class size in terms of student-to-faculty
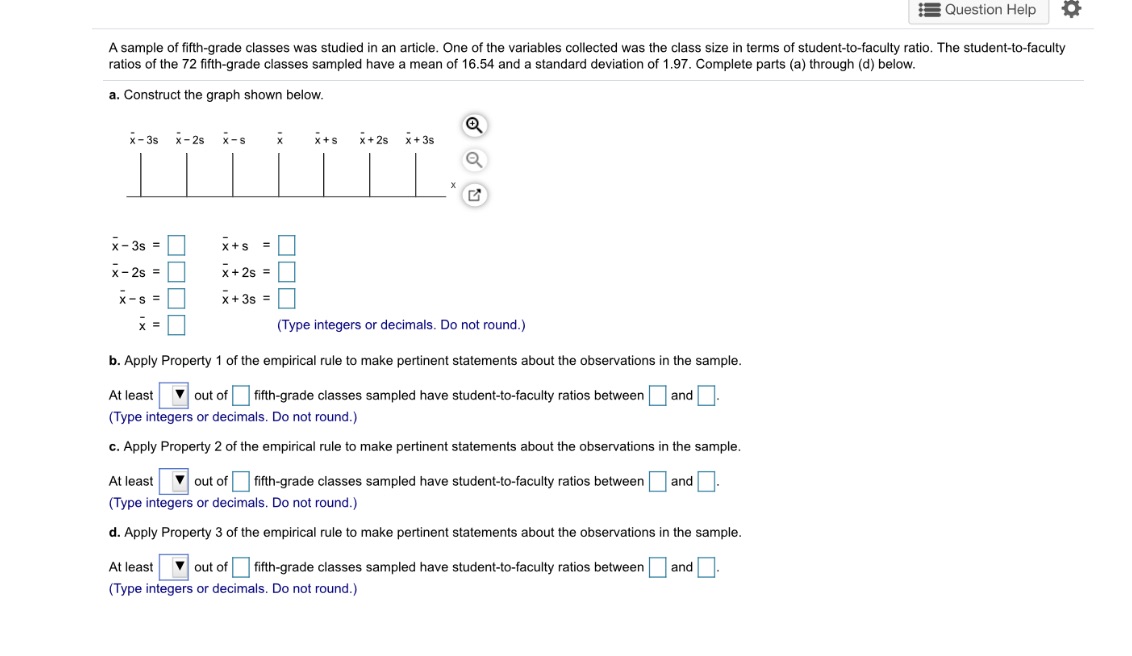
Question Help A sample of fifth-grade classes was studied in an article. One of the variables collected was the class size in terms of student-to-faculty ratio. The student-to-faculty ratios of the 72 fifth-grade classes sampled have a mean of 16.54 and a standard deviation of 1.97. Complete parts (a) through (d) below. a. Construct the graph shown below. * - 35 x - 2s x - s x x+s x+2s x+3s L X x - 3s = x+s = x - 2s = x + 2s = X - s = x + 3s = X = (Type integers or decimals. Do not round.) b. Apply Property 1 of the empirical rule to make pertinent statements about the observations in the sample. At least v out of fifth-grade classes sampled have student-to-faculty ratios between and. (Type integers or decimals. Do not round.) c. Apply Property 2 of the empirical rule to make pertinent statements about the observations in the sample. At least out of fifth-grade classes sampled have student-to-faculty ratios between and (Type integers or decimals. Do not round.) d. Apply Property 3 of the empirical rule to make pertinent statements about the observations in the sample. At least out of fifth-grade classes sampled have student-to-faculty ratios between and (Type integers or decimals. Do not round.)
Step by Step Solution
There are 3 Steps involved in it

Get step-by-step solutions from verified subject matter experts