

Question: Question Help Refer to Table 56.1 - Factors for Computing Control Chart Limits (3 sigma) for this problem Sampling 4 pieces of precision cut wire
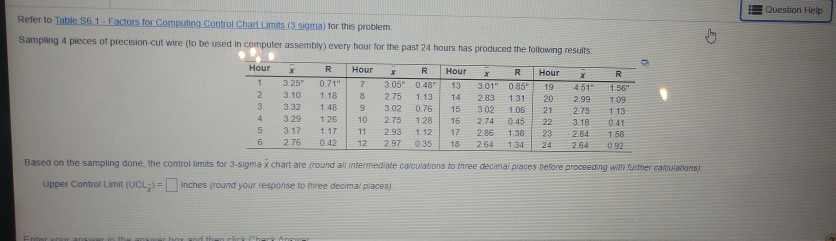
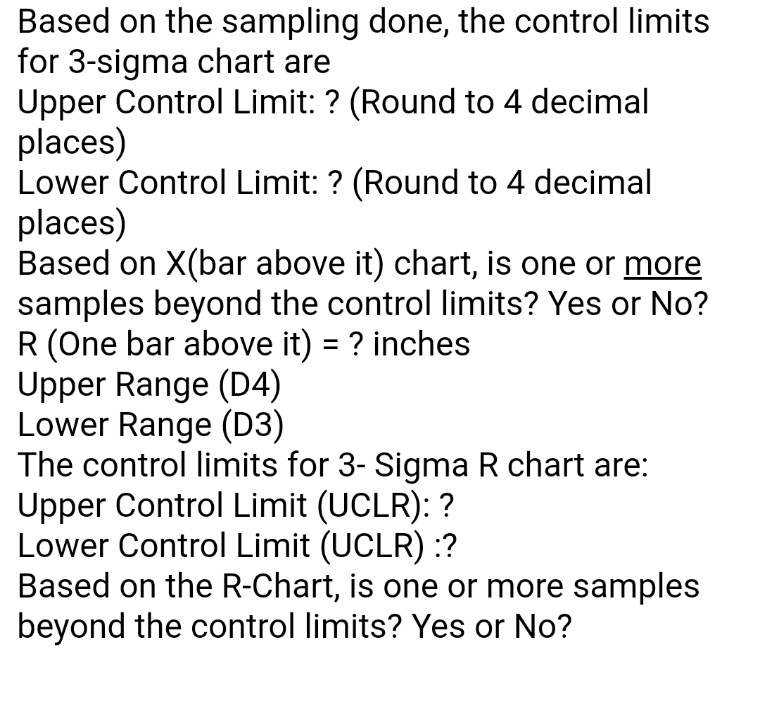
Question Help Refer to Table 56.1 - Factors for Computing Control Chart Limits (3 sigma) for this problem Sampling 4 pieces of precision cut wire (to be used in computer assembly) every hour for the past 24 hours has produced the following results Hour 1 2 3 4 5 6 R Hour R Hour R Hour 3250 71 T 3050 48 13301" 085" 19 451 1.56 3 101 1882 75 1.1314 2.83 131202 99109 3.32148 9 3.02 0.76 153 .021 .05 212.75 113 3.29 126 10 2.75 1.28 162.74 04522 3.18 0.41 3.17 1.17 11 293 1.12 17 286 1.38 23 -2.84 158 275 0.42 12 297 035 13 264 13. 24 264 0.92 Based on the sampling done, the controllimits for 3-syma x chart are found all intermediate calculations to three decimal places before proceeding will further calculations) Upper Control Limit (UCL;) inches (round your response to three decimal places) Based on the sampling done, the control limits for 3-sigma chart are Upper Control Limit: ? (Round to 4 decimal places) Lower Control Limit: ? (Round to 4 decimal places) Based on X(bar above it) chart, is one or more samples beyond the control limits? Yes or No? R (One bar above it) = ? inches Upper Range (D4) Lower Range (D3) The control limits for 3- Sigma R chart are: Upper Control Limit (UCLR): ? Lower Control Limit (UCLR) :? Based on the R-Chart, is one or more samples beyond the control limits? Yes or No
Step by Step Solution
There are 3 Steps involved in it
1 Expert Approved Answer
Step: 1 Unlock

Question Has Been Solved by an Expert!
Get step-by-step solutions from verified subject matter experts
Step: 2 Unlock
Step: 3 Unlock