

Question: Question Help The following data represent the dividend yields (in percent) of a random sample of 28 publicly traded stocks. Complete parts (a) to (c).
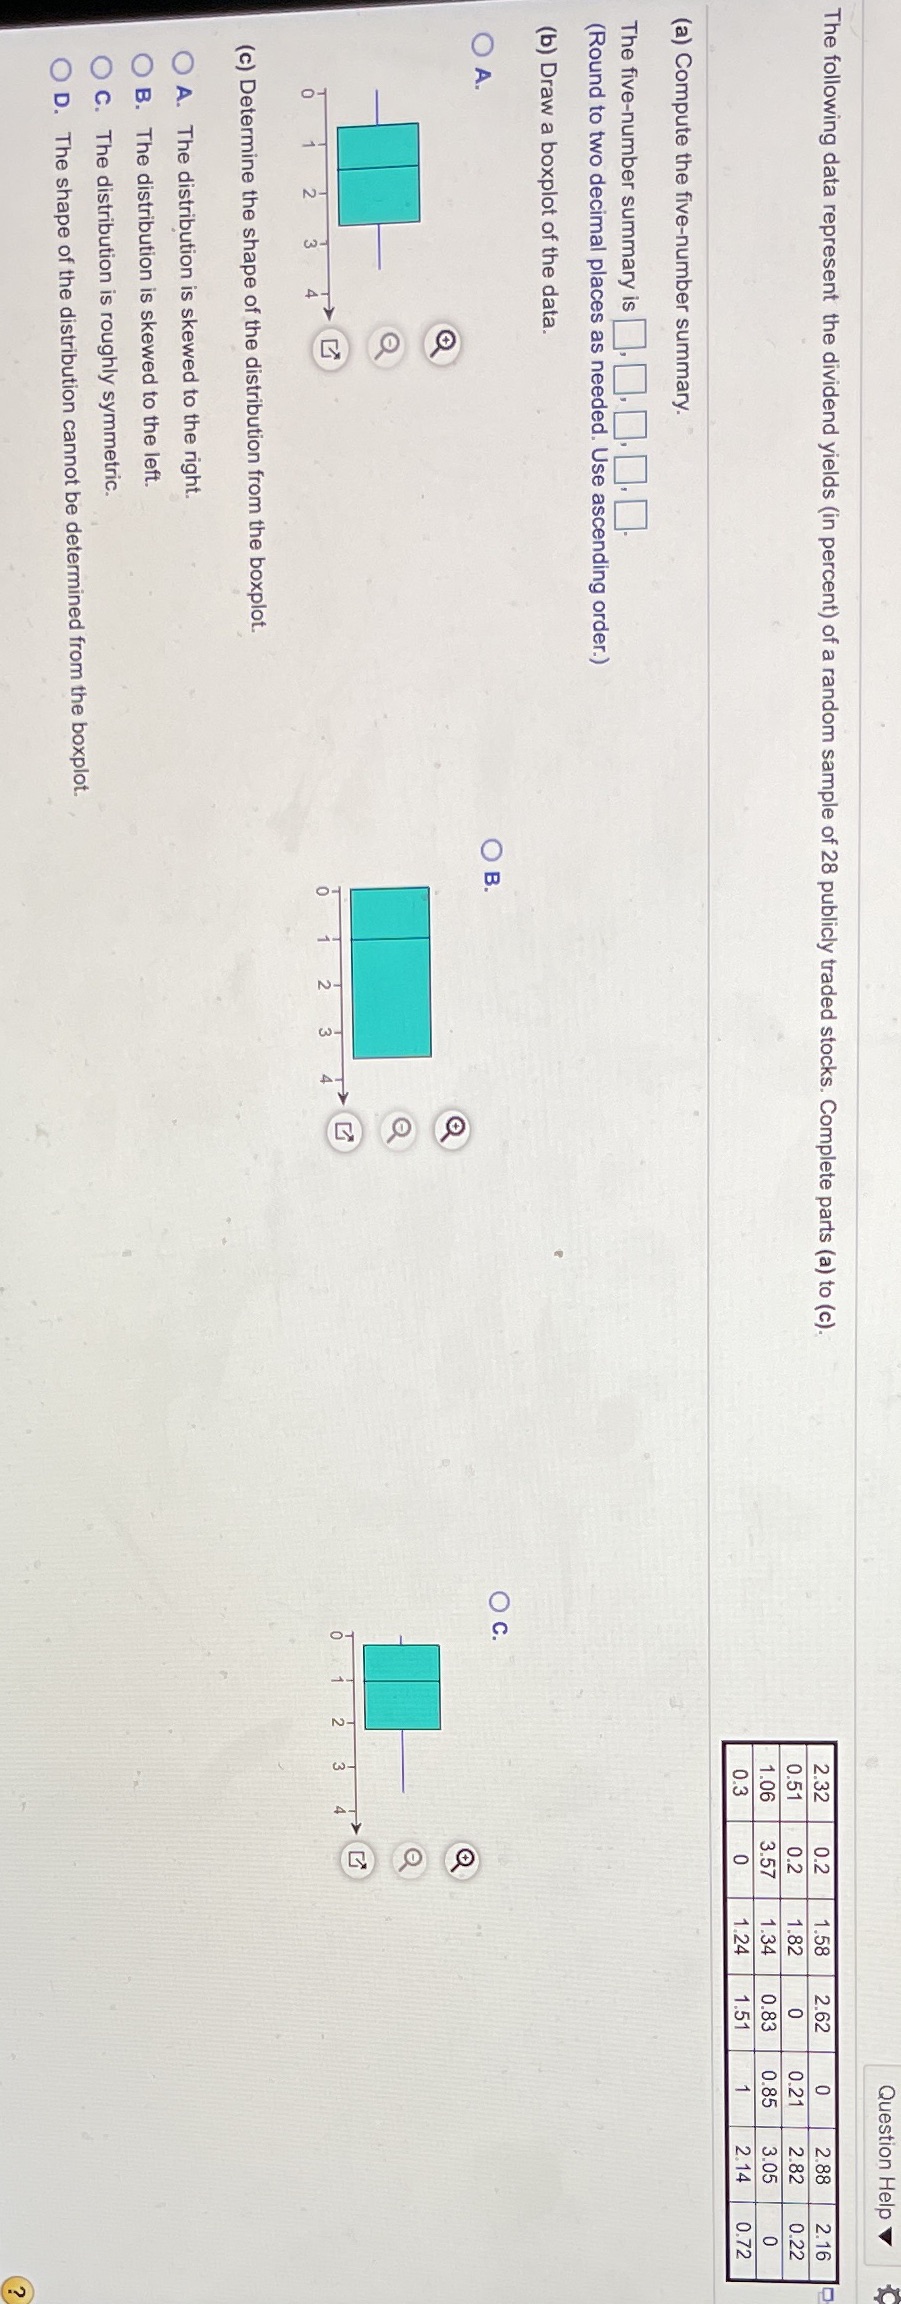
Question Help The following data represent the dividend yields (in percent) of a random sample of 28 publicly traded stocks. Complete parts (a) to (c). 2.32 1.58 2.62 2.88 2.16 0.51 1.82 O 0.21 2.82 0.22 1.06 3.57 1.34 0.83 0.85 3.05 O 0.3 O 1.24 1.51 2.14 0.72 (a) Compute the five-number summary. The five-number summary is , . . . (Round to two decimal places as needed. Use ascending order.) (b) Draw a boxplot of the data. O A. O B. O C. O O O -O -m 3 N N (c) Determine the shape of the distribution from the boxplot. O A. The distribution is skewed to the right. O B. The distribution is skewed to the left. O C. The distribution is roughly symmetric. O D. The shape of the distribution cannot be determined from the boxplot
Step by Step Solution
There are 3 Steps involved in it

Get step-by-step solutions from verified subject matter experts