

Question: Question - How do I use this data to answer the questions for dump Truck utilisation? The average utilisation for the dump truck for the
Question - How do I use this data to answer the questions for dump Truck utilisation?
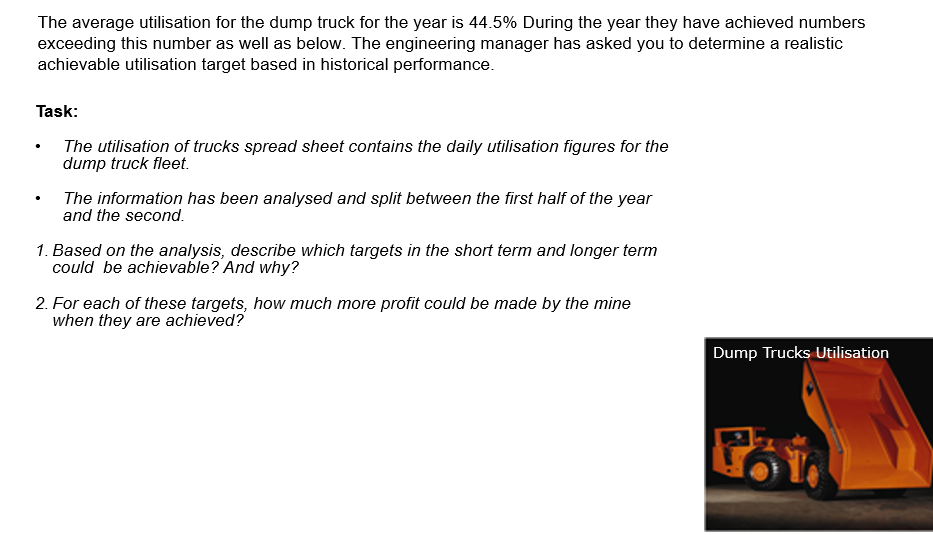
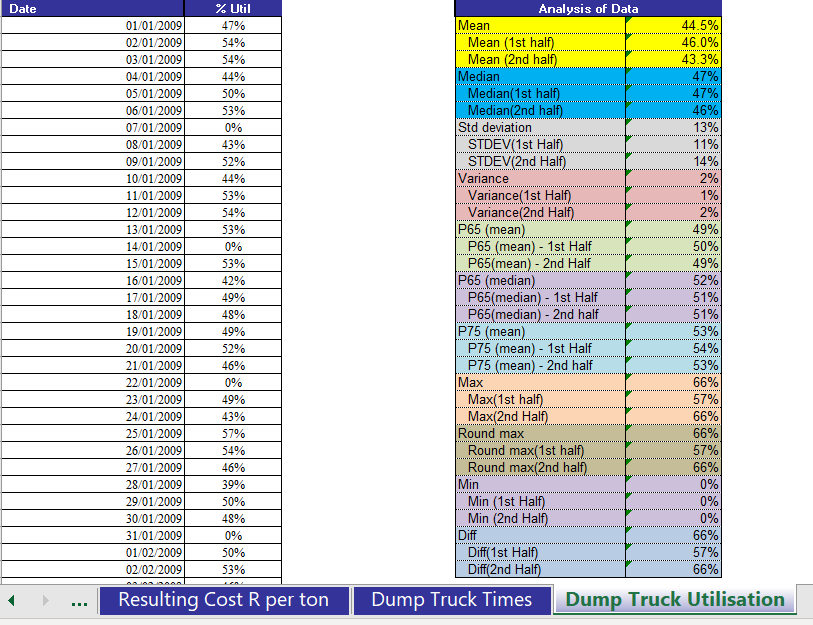
The average utilisation for the dump truck for the year is 44.5% During the year they have achieved numbers exceeding this number as well as below. The engineering manager has asked you to determine a realistic achievable utilisation target based in historical performance. Task: The utilisation of trucks spread sheet contains the daily utilisation figures for the dump truck fleet The information has been analysed and split between the first half of the year and the second 1. Based on the analysis, describe which targets in the short term and longer term could be achievable? And why? 2. For each of these targets, how much more profit could be made by the mine when they are achieved? Dump Trucks Utilisation Y. Date ******** 2% 01/01/2009 02/01/2009 03/01/2009 04/01/2009 05/01/2009 06/01/2009 07/01/2009 08/01/2009 09/01/2009 10/01/2009 11/01/2009 12/01/2009 13/01/2009 14/01/2009 15/01/2009 16/01/2009 17/01/2009 18/01/2009 19/01/2009 20/01/2009 21/01/2009 22/01/2009 23/01/2009 24/01/2009 25/01/2009 26/01/2009 27/01/2009 28/01/2009 29/01/2009 30/01/2009 31/01/2009 01/02/2009 02/02/2009 % Util 47% 54% 54% 44% 50% 53% 0% 43% 52% 44% 53% 54% 53% 0% 53% 42% 49% 48% 49% 52% 46% 0% 49% 43% 57% 54% 46% 39% 50% 48% 0% 50% 53% Analysis of Data Mean 44.5% Mean (1st half) 46.0% Mean (2nd half) 43.3% Median 47% Median(1st half) 47% Median(2nd half 46% Std deviation 13% STDEV(1st Half) 11% STDEV(2nd Half) 14% Variance 2% Variance(1st Half) 1% Variance(2nd Half) P65 (mean) 49% P65 (mean) - 1st Half 50% P65(mean) - 2nd Half 49% P65 (median) 52% P65(median) - 1st Half 51% P65(median) - 2nd half 51% P75 (mean 53% P75 (mean) - 1st Half 54% P75 (mean) - 2nd half 53% | 66% Max(1st half) 57% Max(2nd Half) 66% Round max 66% Round max(1st half) 57% Round max(2nd half) 66% Min 0% Min (1st Half) Min (2nd Half) 0% Diff 66% Diff(1st Half) 57% Diff(2nd Half) 66% Dump Truck Times Dump Truck Utilisation 0% Resulting Cost R per ton II. The average utilisation for the dump truck for the year is 44.5% During the year they have achieved numbers exceeding this number as well as below. The engineering manager has asked you to determine a realistic achievable utilisation target based in historical performance. Task: The utilisation of trucks spread sheet contains the daily utilisation figures for the dump truck fleet The information has been analysed and split between the first half of the year and the second 1. Based on the analysis, describe which targets in the short term and longer term could be achievable? And why? 2. For each of these targets, how much more profit could be made by the mine when they are achieved? Dump Trucks Utilisation Y. Date ******** 2% 01/01/2009 02/01/2009 03/01/2009 04/01/2009 05/01/2009 06/01/2009 07/01/2009 08/01/2009 09/01/2009 10/01/2009 11/01/2009 12/01/2009 13/01/2009 14/01/2009 15/01/2009 16/01/2009 17/01/2009 18/01/2009 19/01/2009 20/01/2009 21/01/2009 22/01/2009 23/01/2009 24/01/2009 25/01/2009 26/01/2009 27/01/2009 28/01/2009 29/01/2009 30/01/2009 31/01/2009 01/02/2009 02/02/2009 % Util 47% 54% 54% 44% 50% 53% 0% 43% 52% 44% 53% 54% 53% 0% 53% 42% 49% 48% 49% 52% 46% 0% 49% 43% 57% 54% 46% 39% 50% 48% 0% 50% 53% Analysis of Data Mean 44.5% Mean (1st half) 46.0% Mean (2nd half) 43.3% Median 47% Median(1st half) 47% Median(2nd half 46% Std deviation 13% STDEV(1st Half) 11% STDEV(2nd Half) 14% Variance 2% Variance(1st Half) 1% Variance(2nd Half) P65 (mean) 49% P65 (mean) - 1st Half 50% P65(mean) - 2nd Half 49% P65 (median) 52% P65(median) - 1st Half 51% P65(median) - 2nd half 51% P75 (mean 53% P75 (mean) - 1st Half 54% P75 (mean) - 2nd half 53% | 66% Max(1st half) 57% Max(2nd Half) 66% Round max 66% Round max(1st half) 57% Round max(2nd half) 66% Min 0% Min (1st Half) Min (2nd Half) 0% Diff 66% Diff(1st Half) 57% Diff(2nd Half) 66% Dump Truck Times Dump Truck Utilisation 0% Resulting Cost R per tonStep by Step Solution
There are 3 Steps involved in it
1 Expert Approved Answer
Step: 1 Unlock

Question Has Been Solved by an Expert!
Get step-by-step solutions from verified subject matter experts
Step: 2 Unlock
Step: 3 Unlock