

Question: Question: How does the organization use data and information to track daily operations, including comparative data? Opportunities and improvement Rational & Resolution Answer: 4.1b Performance
Question: How does the organization use data and information to track daily operations, including comparative data?
| Opportunities and improvement | Rational & Resolution | |
| Answer: |
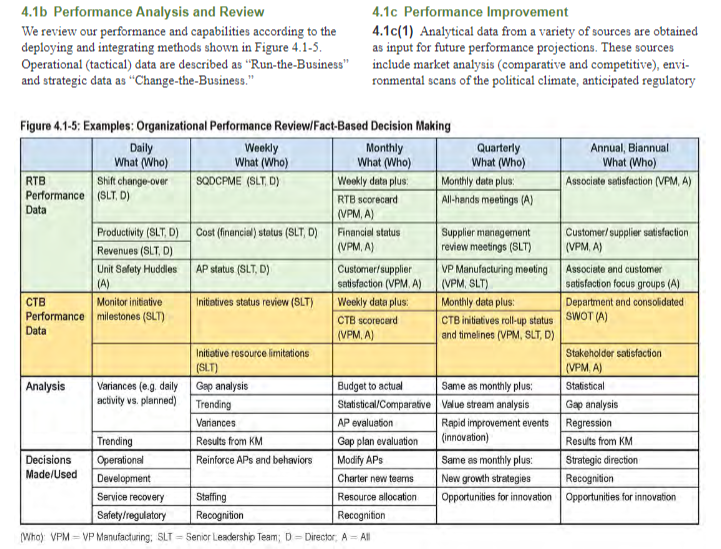
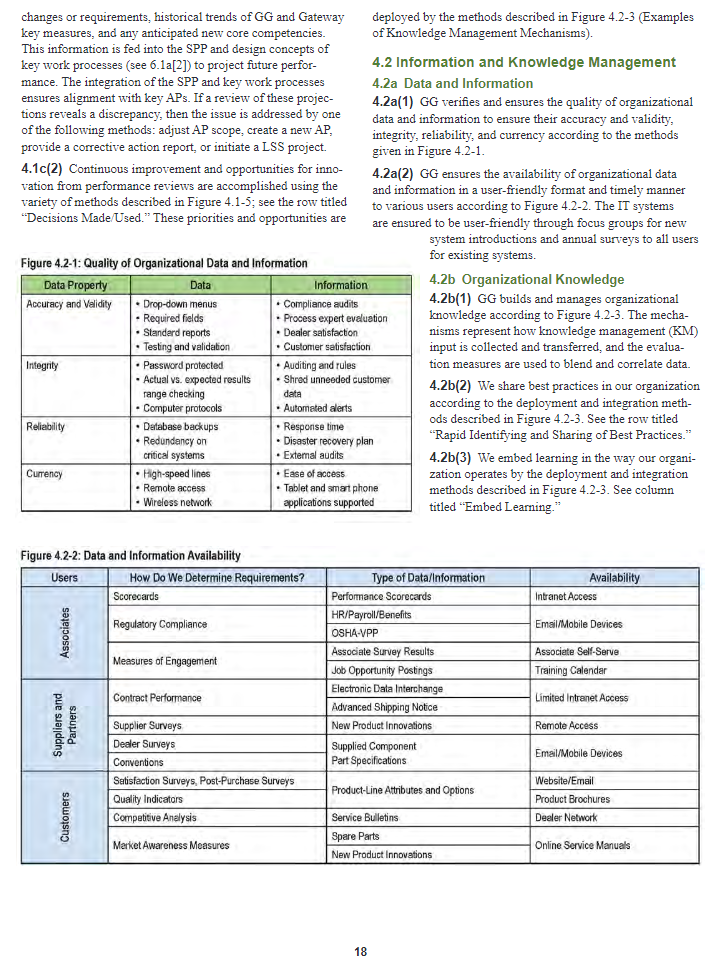
4.1b Performance Analysis and Review We review our performance and capabilities according to the deploying and integrating methods shown in Figure 4.1-5. Operational (tactical) data are described as Run-the-Business" and strategic data as "Change-the-Business." 4.1c Performance Improvement 4.1c(1) Analytical data from a variety of sources are obtained as input for future performance projections. These sources include market analysis (comparative and competitive), envi- ronmental scans of the political climate, anticipated regulatory Figure 4.1-5: Examples: Organizational Performance Review/Fact-Based Decision Making Daily Weekly Monthly Quarterly Annual, Biannual What (Who) What (Who) What (Who) What (Who) What (Who) RTB Shift change-over SQDCPME (SLTD) Weekly data plus Monthly data plus: Associate satisfaction (VPM, A) Performance (SLT, D) RTB scorecard All-hands meetings (A) Data (VPM. A) Productivity (SLT, D) Cost (financial status (SLTD) Financial status Supplier management Customer/supplier satisfaction Revenues (SLT, D) (VPM. A) review meetings (SLT) (VPMA) Unit Safety Huddles AP status (SLT, D) Customer/supplier VP Manufacturing meeting Associate and customer (A) satisfaction (VPM. A) (VPM, SLT) satisfaction focus groups (A) CTB Monitor initiative Initiatives status review (SLT) Weekly data plus Monthly data plus: Department and consolidated Performance milestones (SLT) CTB scorecard CTB initiatives roll-up status SWOT (A) Data (VPM. A) and timelines (VPM, SLT, D) Initiative resource limitations Stakeholder satisfaction (SLT) (VPMA) Analysis Variances (e.g daily Gap analysis Budget to actual Same as monthly plus Statistical activity vs. planned) Trending Statistical/Comparative Value stream analysis Gap analysis Varances AP evaluation Rapid improvement events Regression Trending Results from KM Gap plan evaluation (innovation) Results from KM Decisions Operational Reinforce APs and behaviors Modify APS Same as monthly plus: Strategic direction Made/Used Development Charter new tearns New growth strategies Recognition Service recovery Staffing Resource allocation Opportunities for innovation Opportunities for innovation Safety/regulatory Recognition Recognition (Wh) VPM - VP Manufacturing: SLT = Senior Leadership Team; DDirector A=All changes or requirements, historical trends of GG and Gateway deployed by the methods described in Figure 4.2-3 (Examples key measures, and any anticipated new core competencies of Knowledge Management Mechanisms). This information is fed into the SPP and design concepts of key work processes (see 6.1a[2]) to project future perfor 4.2 Information and Knowledge Management mance. The integration of the SPP and key work processes 4.2a Data and Information ensures alignment with key APs. If a review of these projec- 4.2a(1) GG verifies and ensures the quality of organizational tions reveals a discrepancy, then the issue is addressed by one data and information to ensure their accuracy and validity, of the following methods: adjust AP scope, create a new AP, integrity, reliability, and currency according to the methods provide a corrective action report, or initiate a LSS project. given in Figure 4.2-1. 4.1c(2) Continuous improvement and opportunities for inno- 4.2a(2) GG ensures the availability of organizational data vation from performance reviews are accomplished using the and information in a user-friendly format and timely manner variety of methods described in Figure 4.1-5; see the row titled to various users according to Figure 4.2-2. The IT systems Decisions Made Used." These priorities and opportunities are are ensured to be user-friendly through focus groups for new system introductions and annual surveys to all users for existing systems. Figure 4.2-1: Quality of Organizational Data and Information Data Property Data Information 4.2b Organizational Knowledge Accuracy and Validity Drop-down menus Compliance audits 4.2b(1) GG builds and manages organizational - Required fields Process expert evaluation knowledge according to Figure 4.2-3. The mecha- Standard reports Dealer satisfaction nisms represent how knowledge management (KM) Testing and validation Customer satisfaction input is collected and transferred, and the evalua- Integrity Password protected tion measures are used to blend and correlate data - Actual vs. expected results Shred unneeded customer 4.2b(2) We share best practices in our organization data Computer protocols Automated alerts according to the deployment and integration meth- Reliability Database backups ods described in Figure 4.2-3. See the row titled Response time Redundancy on Disaster recovery plan "Rapid Identifying and Sharing of Best Practices." critical systems External audits 4.2b(3) We embed learning in the way our organi- Currency High-speed lines Ease of access zation operates by the deployment and integration Remote access Tablet and smartphone methods described in Figure 4.2-3. See column Wireless network applications supported titled "Embed Learning . Auditing and rules range checking Figure 4.2-2: Data and Information Availability Users How Do We Determine Requirements? Scorecards Availability Intranet Access Regulatory Compliance Email/Mobile Devices Associates Measures of Engagement Type of Data/Information Performance Scorecards HR/Payroll/Benefits OSHA-VPP Associate Survey Results Job Opportunity Postings Electronic Data Interchange Advanced Shipping Notice New Product Innovations Supplied Component Part Specifications Associate Self-Serve Training Calendar Contract Performance Limited Intranet Access Suppliers and Partners Remote Access Email/Mobile Devices Supplier Surveys Dealer Surveys Conventions Satisfaction Surveys, Post-Purchase Surveys Quality Indicators Competitive Analysis Product-Line Attributes and Options Customers Website/Email Product Brochures Dealer Network Service Bulletins Spare Parts New Product Innovations Market Awareness Measures Online Service Manuals 18
Step by Step Solution
There are 3 Steps involved in it
1 Expert Approved Answer
Step: 1 Unlock

Question Has Been Solved by an Expert!
Get step-by-step solutions from verified subject matter experts
Step: 2 Unlock
Step: 3 Unlock