

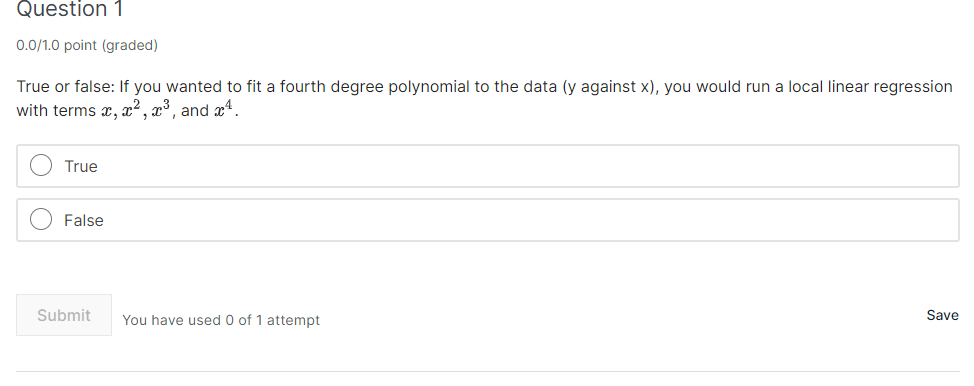
Question: Question 'I DDHD point (graded) True or false: If you wanted to fit a fourth degree polynomial to the data {y against x}, you would

![that apply} E] Ho d'ng everything e se fixed, as bandwidth goes](https://s3.amazonaws.com/si.experts.images/answers/2024/06/667857649de6c_724667857647dbc9.jpg)
![to 0, bias goes to O. E] Ho d'ng everything e se](https://s3.amazonaws.com/si.experts.images/answers/2024/06/6678576520bcd_7256678576509443.jpg)
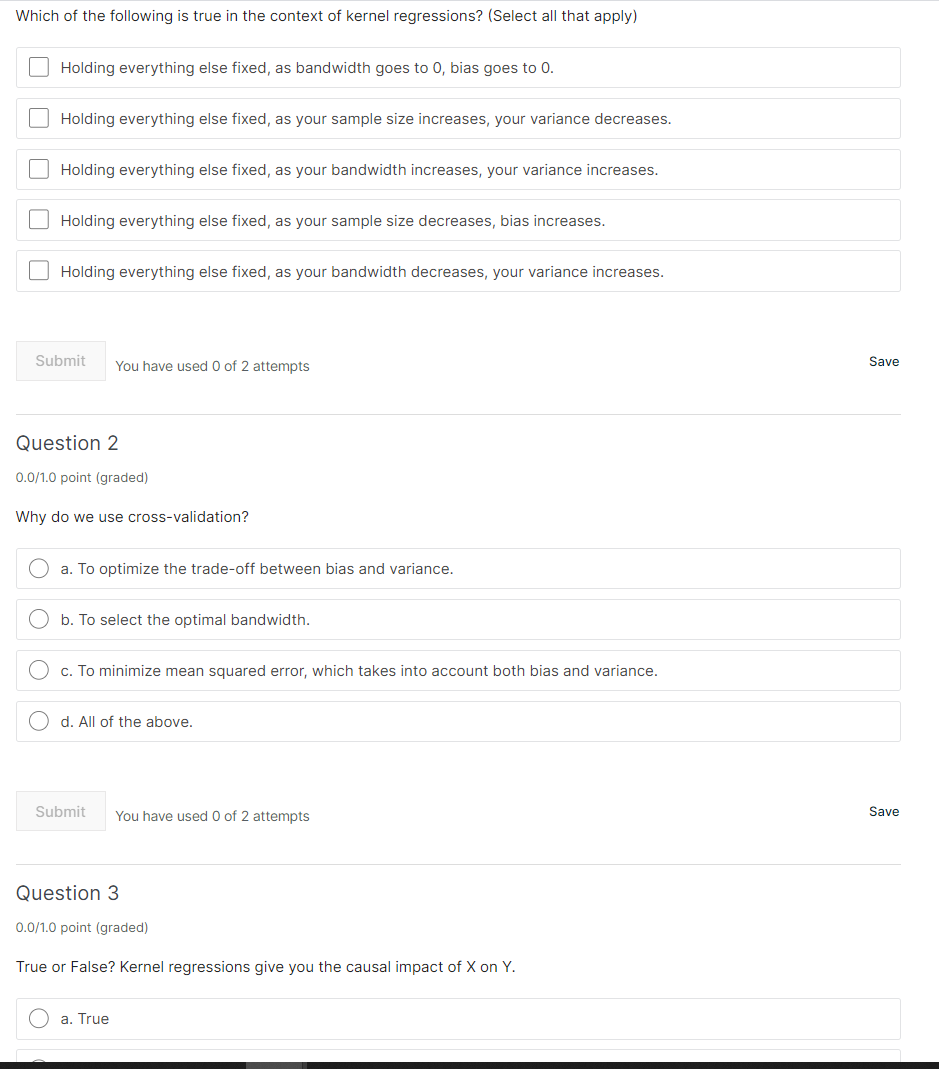
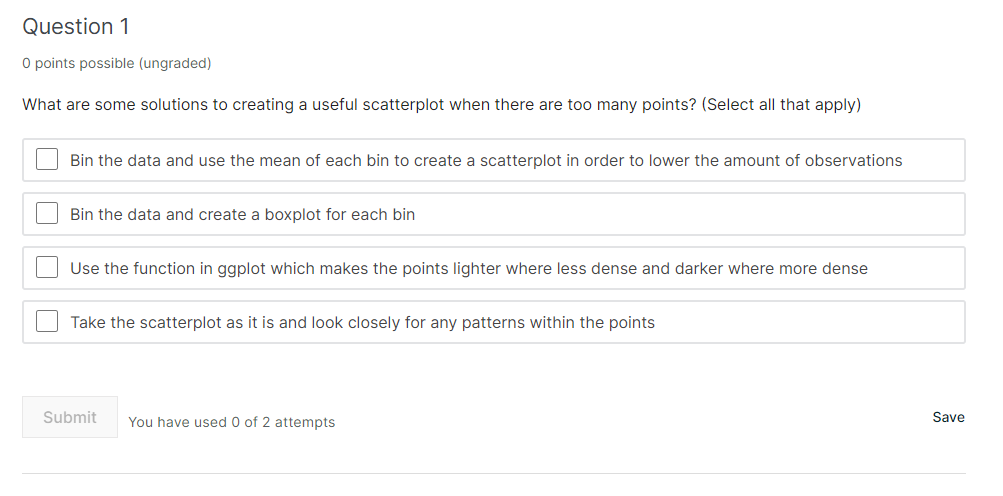
Question 'I DDHD point (graded) True or false: If you wanted to fit a fourth degree polynomial to the data {y against x}, you would run a local linear regression with terms at, $2, :33. and :11". Submit You have used [1 of1 attempt Save Which of the following is true in the context of kernel regressions? {Select all that apply} E] Ho d'ng everything e se fixed, as bandwidth goes to 0, bias goes to O. E] Ho d'ng everything e se fixed, as your sample size increases, your variance decreases. E] -|o d'ng everything e se fixed, as your bandwidth increases, your variance increases. D -|o d'ng everything e se fixed, as your sample size decreases, bias increases. D Ho d'ng everything e se fixed, as your bandwidth decreases, your variance increases. Smelt You have used CI of 2 attempts Save Question 2 0.0110 point [graded] Why do we use crossvalidation? O a. To optimize the tradeolf between bias and variance. 0 b. To select the optimal bandwidth. 0 c. To minimize mean squared error, which takes into account both bias and variance. 0 d. All of the above. Smelt You have used 0 of 2 attempts Save Question 3 D point [graded] True or False? Kernel regressions give you the causal impact of X on Y. O a. True Question 1 0 points possible [ungradedi What are some solutions to creating a useful scatterplot when there are too many points? {Select all that apply] E] Bin the data and use the mean of each bin to create a scatterplot in order to lower the amount of observations E] Bin the data and create a boxplot for each bin C] Use the function in ggplot which makes the points lighter where less dense and darker where more dense E] Take the scatterplot as it is and look closely for any patterns within the points Submit You have used [1 of 2 attempts Save
Step by Step Solution
There are 3 Steps involved in it

Get step-by-step solutions from verified subject matter experts