

Question: Question II - Performance Analysis I. Import the file bread.retess of daily returns on the Berkshire Hathaway portfolio, and convert them to monthly returns. 2.
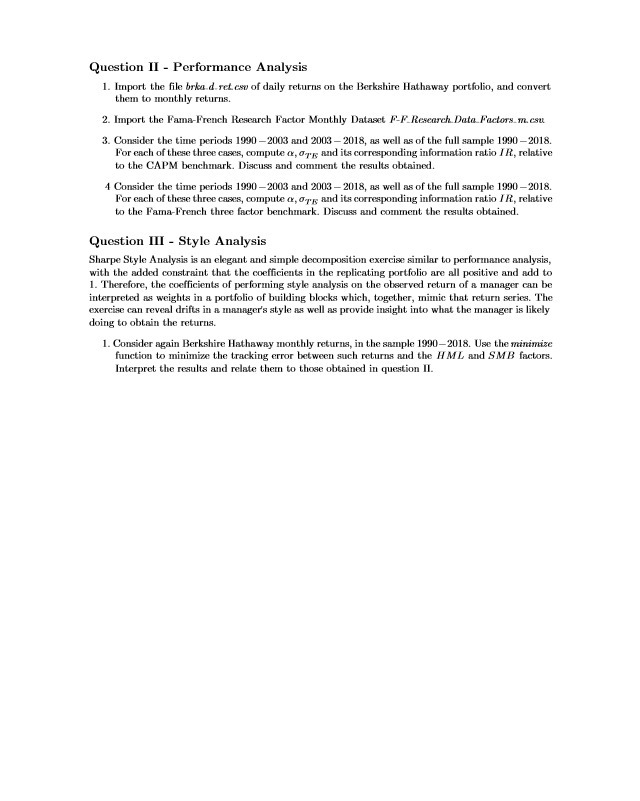
Question II - Performance Analysis I. Import the file bread.retess of daily returns on the Berkshire Hathaway portfolio, and convert them to monthly returns. 2. Import the Fama-French Research Factor Monthly Dataset F-F Research Data Factors. m. cau 3. Consider the time periods 1990 -2003 and 2003 -2018, as well as of the full sample 1990 -2018. For each of these three cases, compute or, Tang and its corresponding information ratio / R, relative to the CAPM benchmark. Discuss and comment the results obtained. 4 Consider the time periods 1990 -2003 and 2003 -2018, as well as of the full sample 1990 -2018. For each of these three cases, compute (, Tyng and its corresponding information ratio / , relative to the Fama-French three factor benchmark. Discuss and comment the results obtained. Question III - Style Analysis Sharpe Style Analysis is an elegant and simple decomposition exercise similar to performance analysis, with the added constraint that the coefficients in the replicating portfolio are all positive and add to 1. Therefore, the coefficients of performing style analysis on the observed return of a manager can be interpreted as weights in a portfolio of building blocks which, together, mimic that return serica. The exercise can reveal drifts in a manager's style as well as provide insight into what the manager is likely doing to obtain the returna. 1. Consider again Berkshire Hathaway monthly returns, in the sample 1990-2018. Use the minimize function to minimize the tracking error between such returns and the H ML and SMB factors. Interpret the results and relate them to those obtained in
Step by Step Solution
There are 3 Steps involved in it

Get step-by-step solutions from verified subject matter experts