

Question: Question In picture. (9 points total) Five yea rs ago, the average math SAT score for students at one school was 475. A teacher wants
Question In picture.
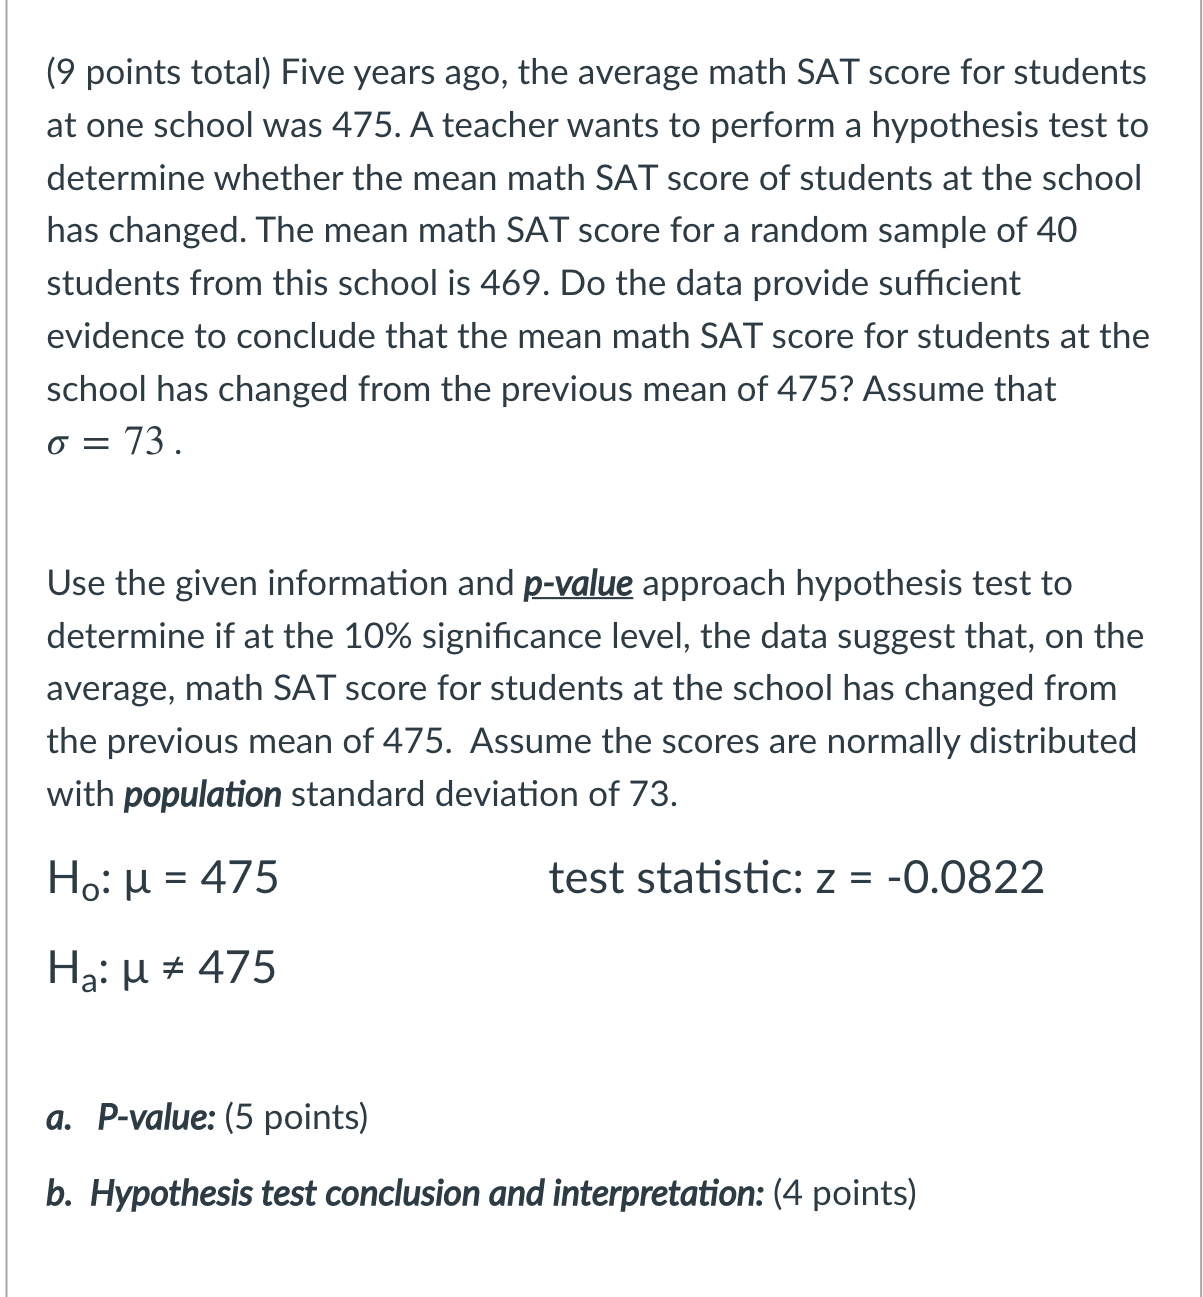
(9 points total) Five yea rs ago, the average math SAT score for students at one school was 475. A teacher wants to perform a hypothesis test to determine whether the mean math SAT score of students at the school has changed. The mean math SAT score for a random sample of 40 students from this school is 469. Do the data provide sufficient evidence to conclude that the mean math SAT score for students at the school has changed from the previous mean of 475? Assume that 0:73. Use the given information and [m approach hypothesis test to determine if at the 10% signicance level, the data suggest that, on the average, math SAT score for students at the school has changed from the previous mean of 475. Assume the scores are normally distributed with population standard deviation of 73. H0: u = 475 test statistic: z = -0.0822 Ha: u at 475 a. P-value: (5 points) b. Hypothesis test conclusion and interpretation: (4 points)
Step by Step Solution
There are 3 Steps involved in it

Get step-by-step solutions from verified subject matter experts