

Question: Question In the graph below, the solid blue line represents the marginal cost of reducing particle emissions (measured in pounds) for a firm. The green
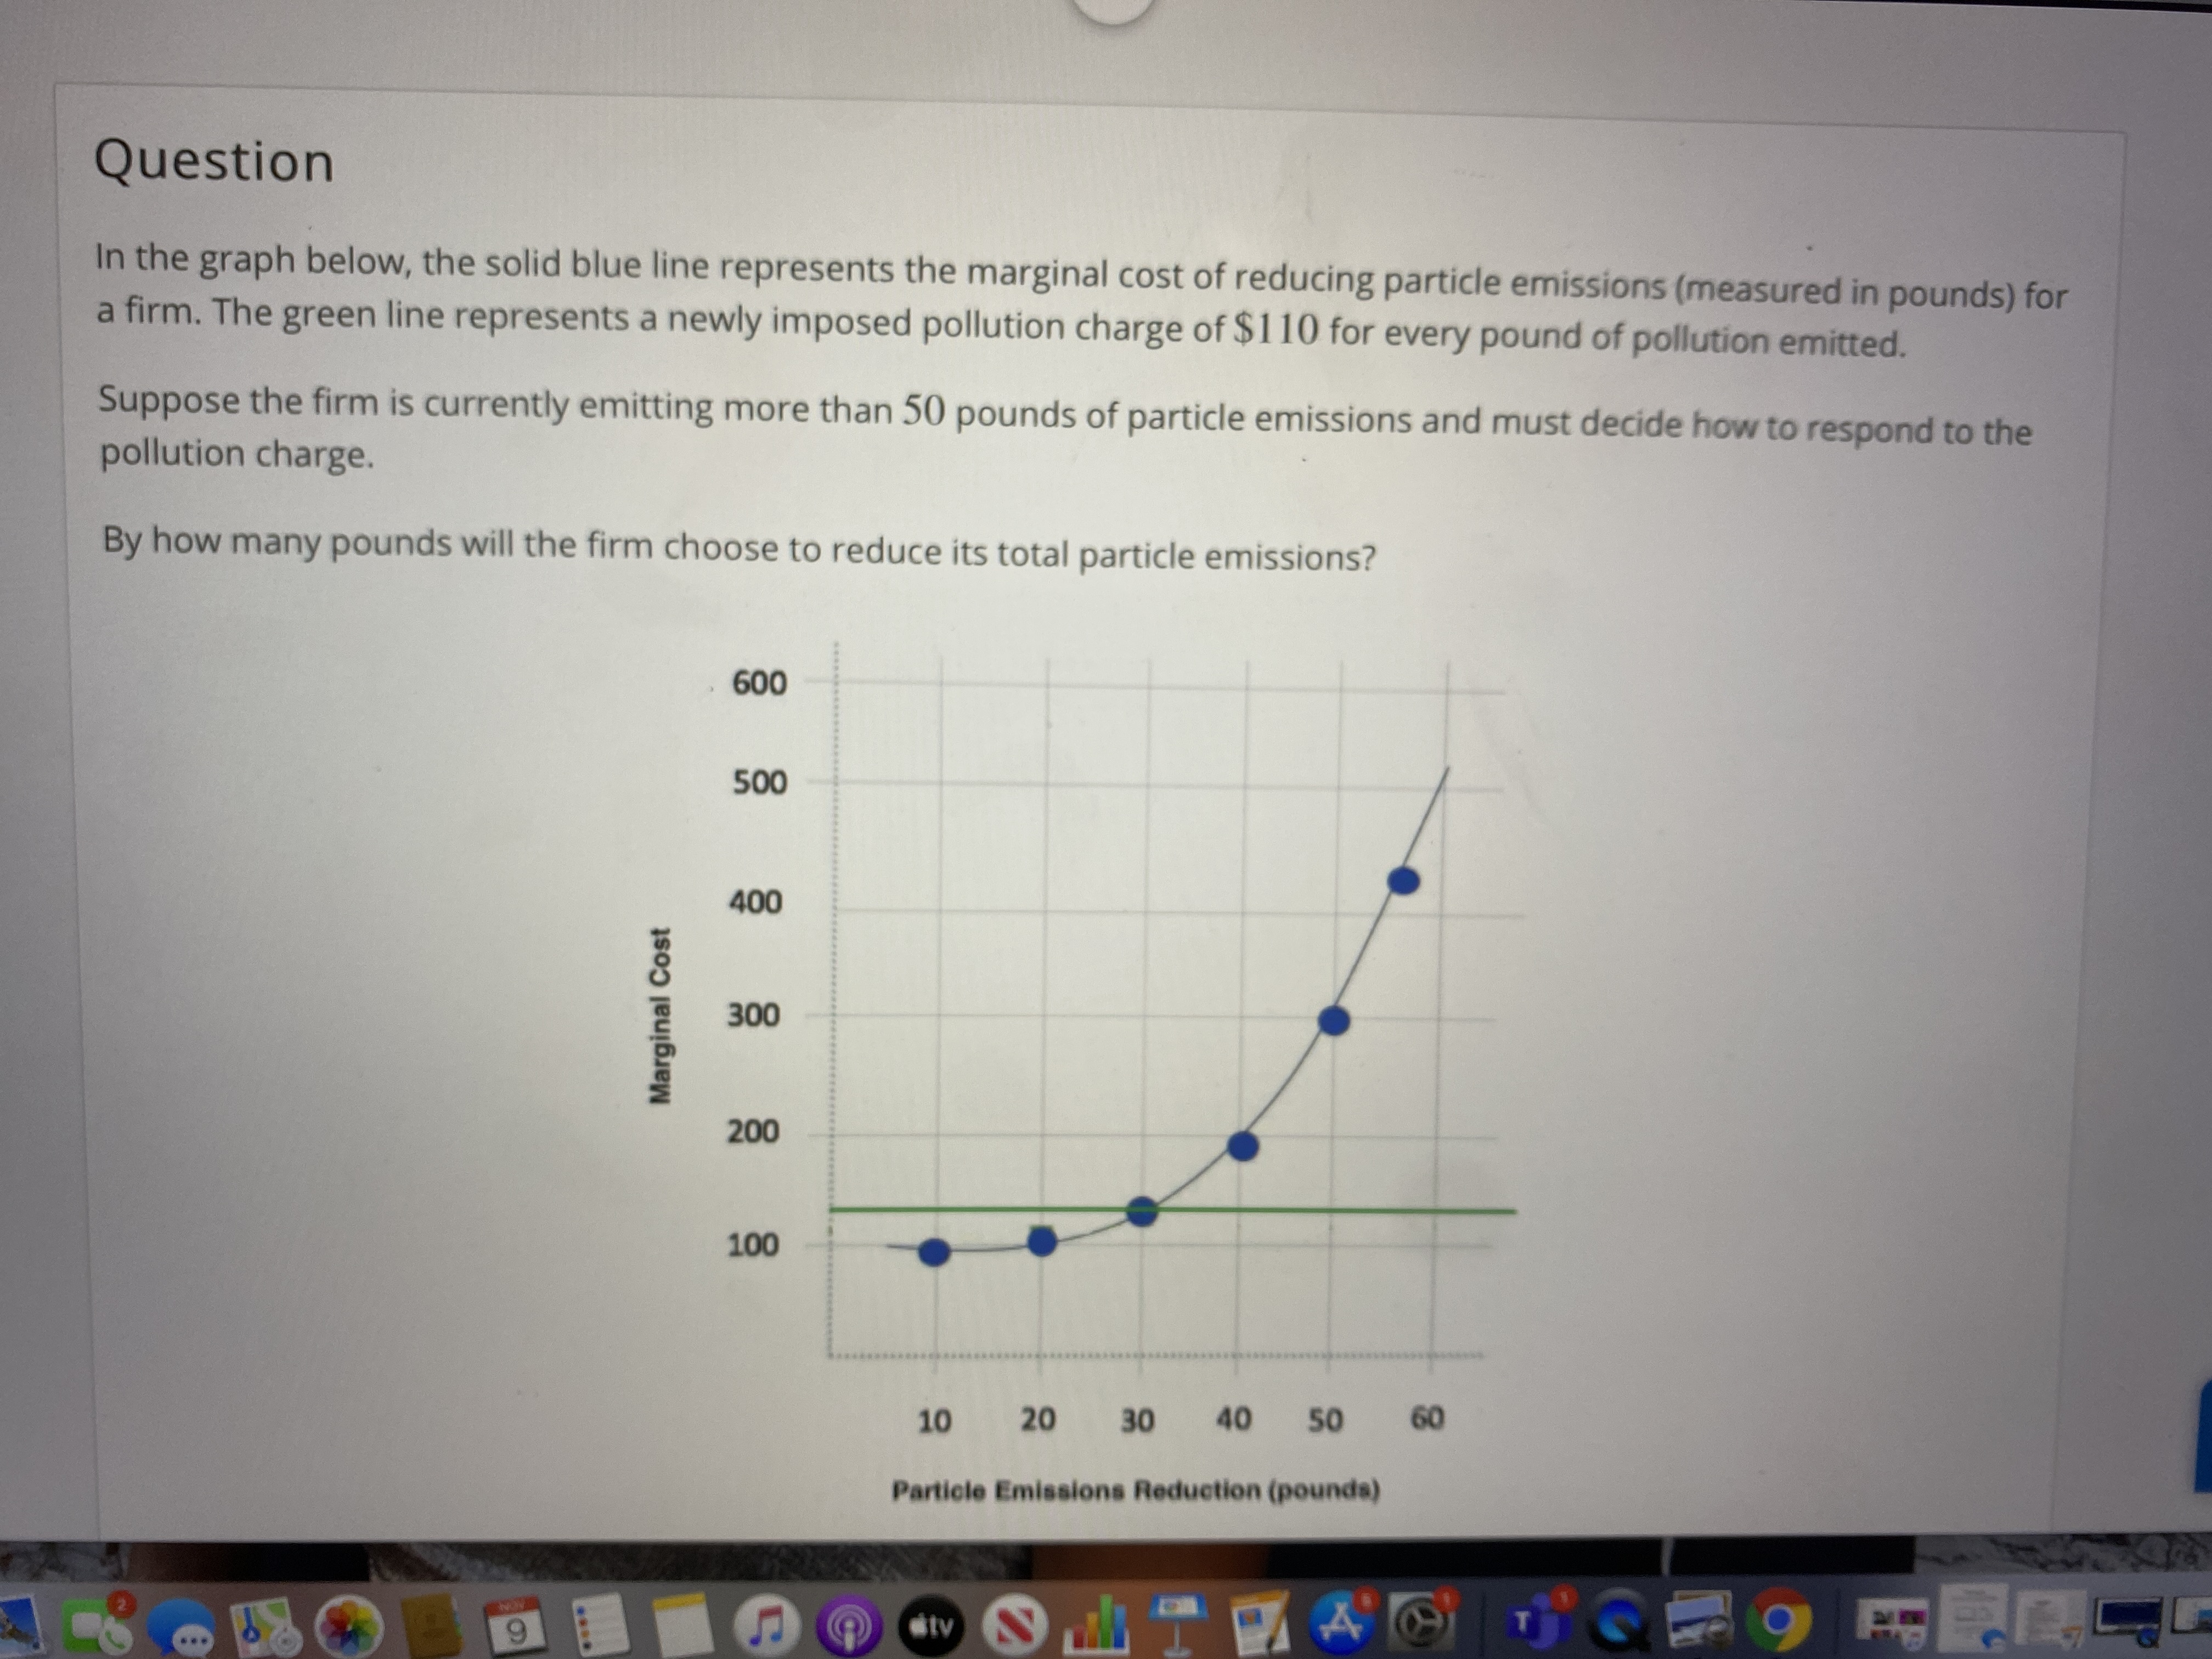
Question In the graph below, the solid blue line represents the marginal cost of reducing particle emissions (measured in pounds) for a firm. The green line represents a newly imposed pollution charge of $1 10 for every pound of pollution emitted. Suppose the firm is currently emitting more than 50 pounds of particle emissions and must decide how to respond to the pollution charge. By how many pounds will the firm choose to reduce its total particle emissions? 600 500 400 Marginal Cost 300 200 100 10 20 30 40 50 60 Particle Emissions Reduction (pounds) ... 9 City
Step by Step Solution
There are 3 Steps involved in it
1 Expert Approved Answer
Step: 1 Unlock

Question Has Been Solved by an Expert!
Get step-by-step solutions from verified subject matter experts
Step: 2 Unlock
Step: 3 Unlock