

Question: question in the image 5) Using the gure below, identify a data point that indicates there are other variables affecting the relationship (e.g., evidence that
question in the image
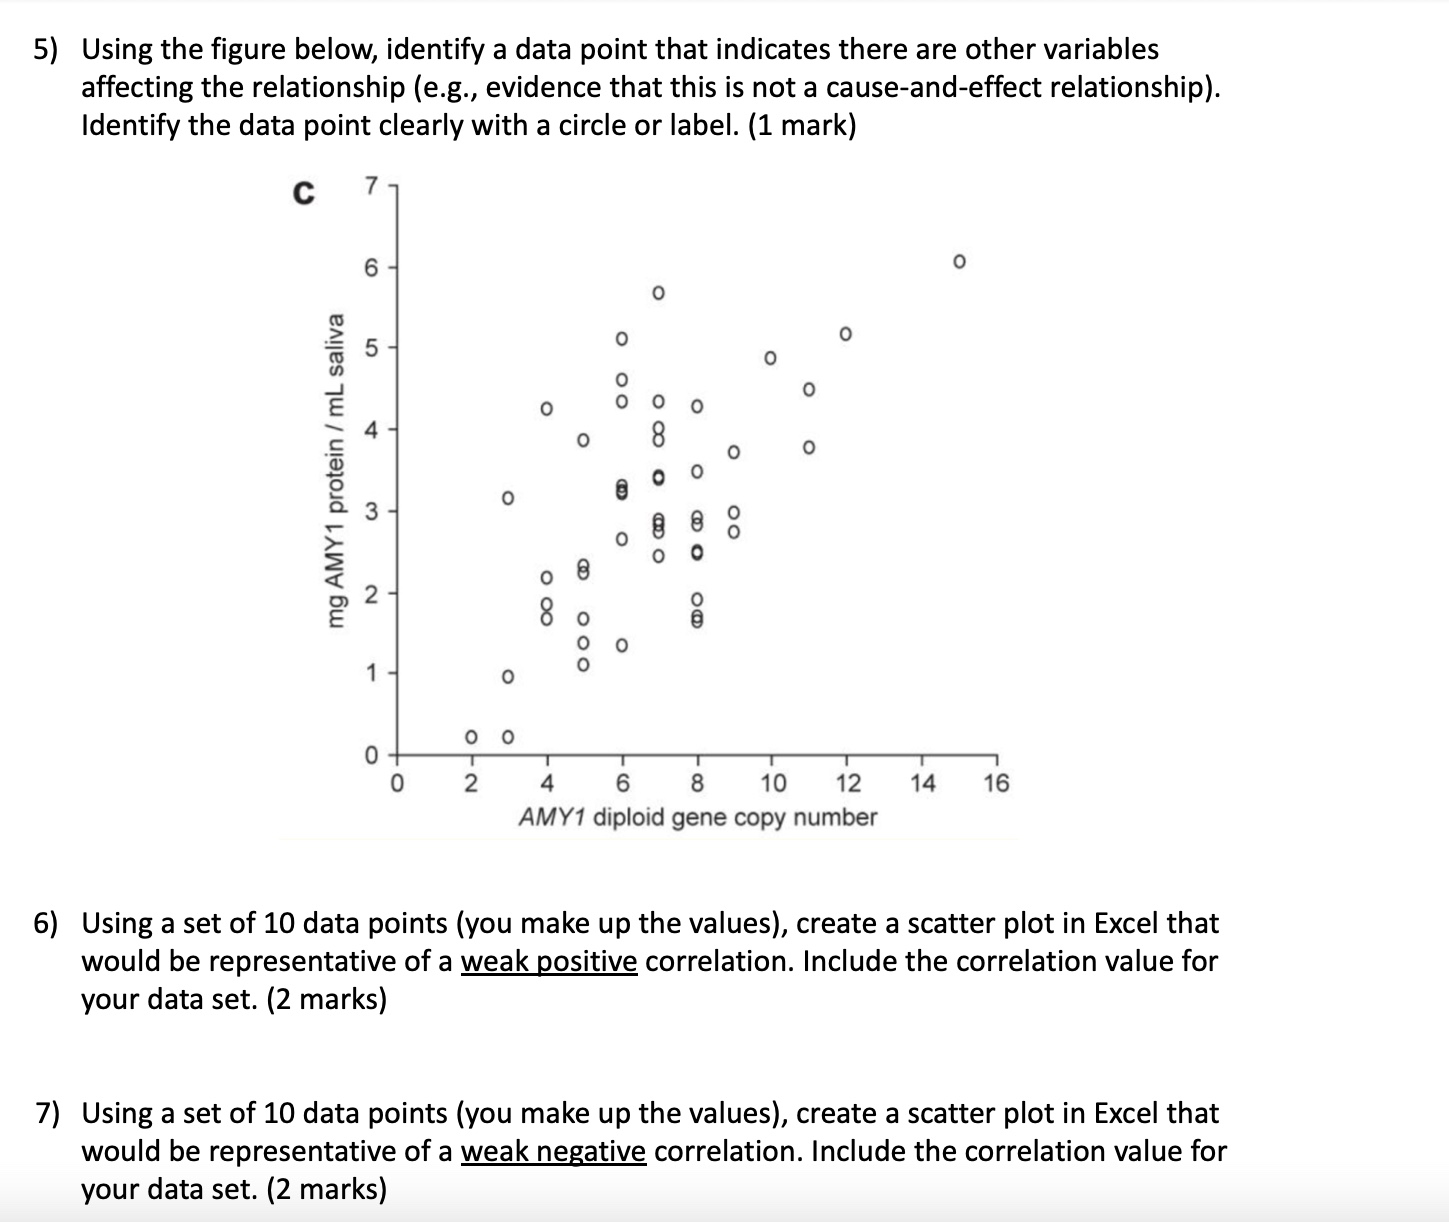
5) Using the gure below, identify a data point that indicates there are other variables affecting the relationship (e.g., evidence that this is not a cause-and-effect relationship). Identify the data point clearly with a circle or label. (1 mark) h 0! (A) mg AMY1 protein I mL saliva M 0 2 4 6 8 10 12 14 16 AMY1 diploid gene copy number 6) Using a set of 10 data points (you make up the values), create a scatter plot in Excel that would be representative of a weak positive correlation. Include the correlation value for your data set. (2 marks) 7) Using a set of 10 data points (you make up the values), create a scatter plot in Excel that would be representative of a weak negative correlation. Include the correlation value for your data set. (2 marks)
Step by Step Solution
There are 3 Steps involved in it

Get step-by-step solutions from verified subject matter experts