

Question: Question: In this homework, you will develop a linear regression supervised learning model. The training data for your model will be 'train.csv , and you
Question: In this homework, you will develop a linear regression supervised learning model. The training data for your model will be 'train.csv and you will test your model using 'test.csvLinear Regression Approach: You will find out a line y mx c that best fits the training data. Start witha random value for m and c then update the values based on the following cost function and optimization equations. Here, E is the cost function you will use, the average of squared error that occurred between the predicted and actual values from the training data. Use the equations for mn and c to update m and c from previous values.Experimental Details:Parameter Values: In your implementation, update the values of m and c times, or run it for epochs, and use for the learning rate a value. If the error value does not converge, you can also try different parameter values like epochs and for the learning rate a value, etc.Total Error Tracking: Keep a variable to track total error in different iterations. Initially, it can be an empty list. For every run, add the total error value to the list. We will use this list later to visualize how the total error converges throughout the iterations epochs.Testing your Model: Once you find optimum values for m and c predict y compare with actual y values, and measure the total error EPlotting the curves:You need to generate three plots after you train and test your model Training Data and Optimum Line: This plot will show the training data points as a scatter plot and the optimum line you found after the training process, giving you an idea of how the optimum line fits the training data points. Use training data points and optimum m and c to draw this polt Testing Data and Optimum Line: This plot will show the test data points as a scatter plot and the optimum line you found after the training process, giving you an idea of how generalized the optimum line is to fit the test data points. Use test data points and optimum values of m and c to draw this plot Error Convergence: This plot will show how the error has converged or reached a minimum point over the epochs. Use the Total Error Tracking list to show the error convergence. Using this code: Python code for scatter plot with a regression line:The above code will generate the following plot. In line you will get the mb from your implemented linear regression program instead of using the function from NumPy.
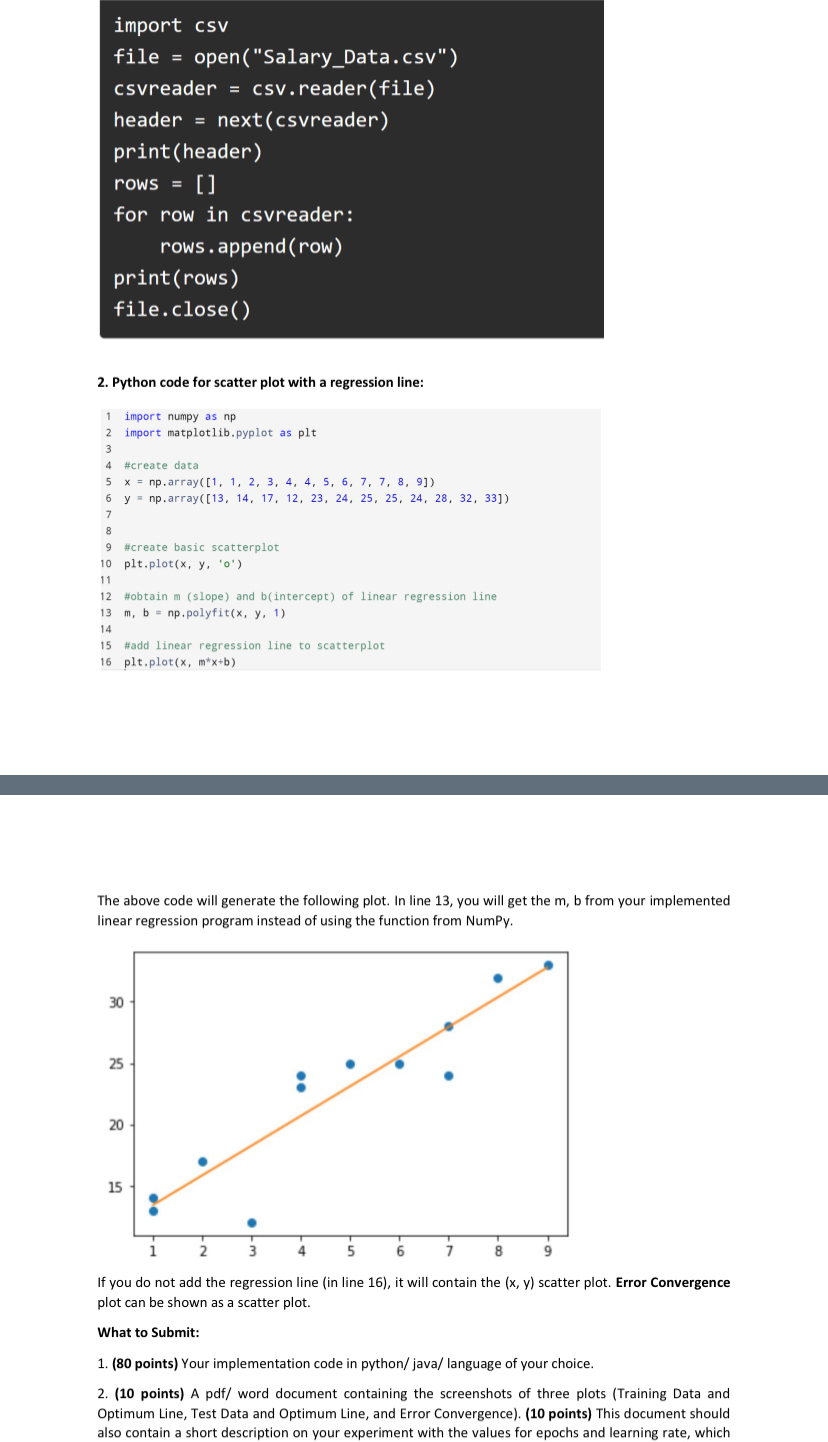
If you do not add the regression line in line it will contain the scatter plot. Error Convergence plot can be shown as a scatter plot.
What to Submit:
points Your implementation code in python java language of your choice.
points A pdf word document containing the screenshots of three plots Training Data and Optimum Line, Test Data and Optimum Line, and Error Convergence points This document should also contain a short description on your experiment with the values for epochs and learning rate
Step by Step Solution
There are 3 Steps involved in it
1 Expert Approved Answer
Step: 1 Unlock

Question Has Been Solved by an Expert!
Get step-by-step solutions from verified subject matter experts
Step: 2 Unlock
Step: 3 Unlock