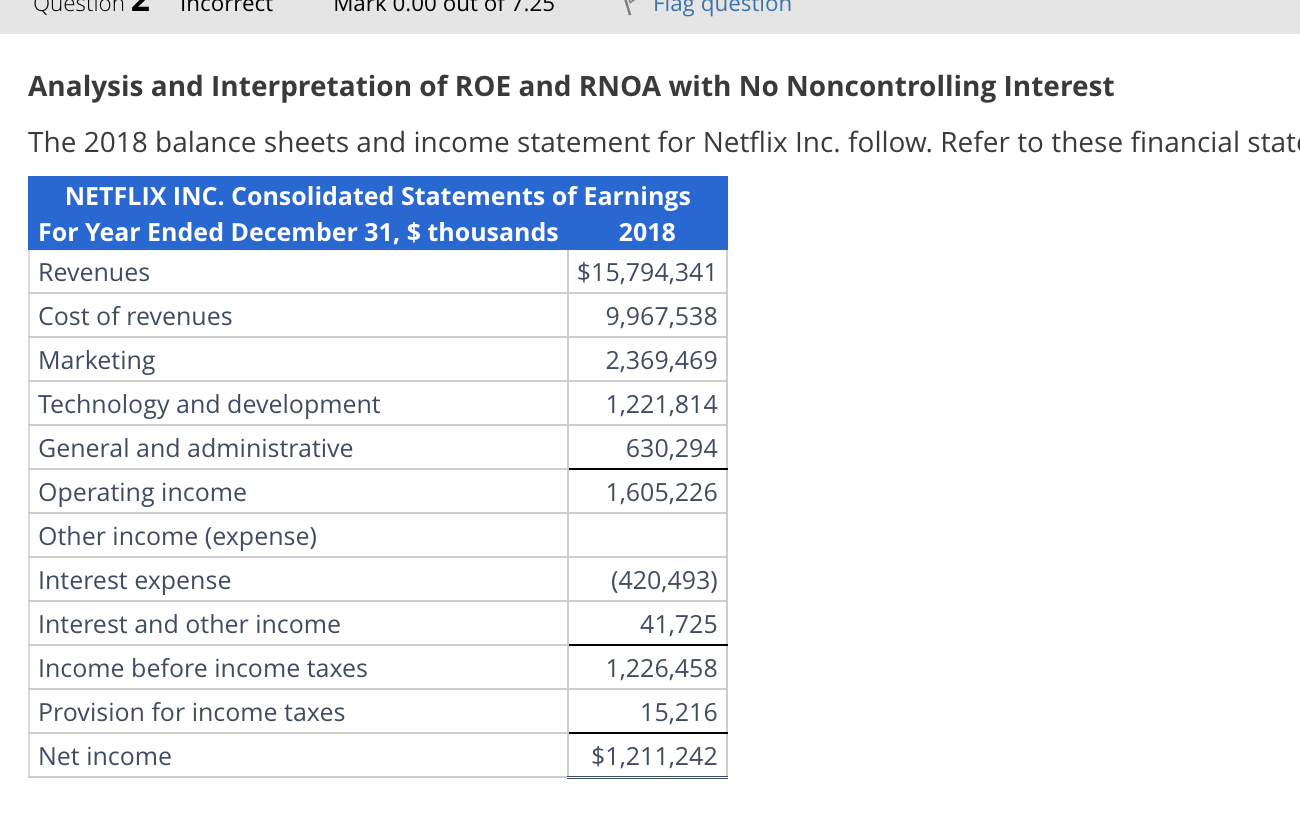
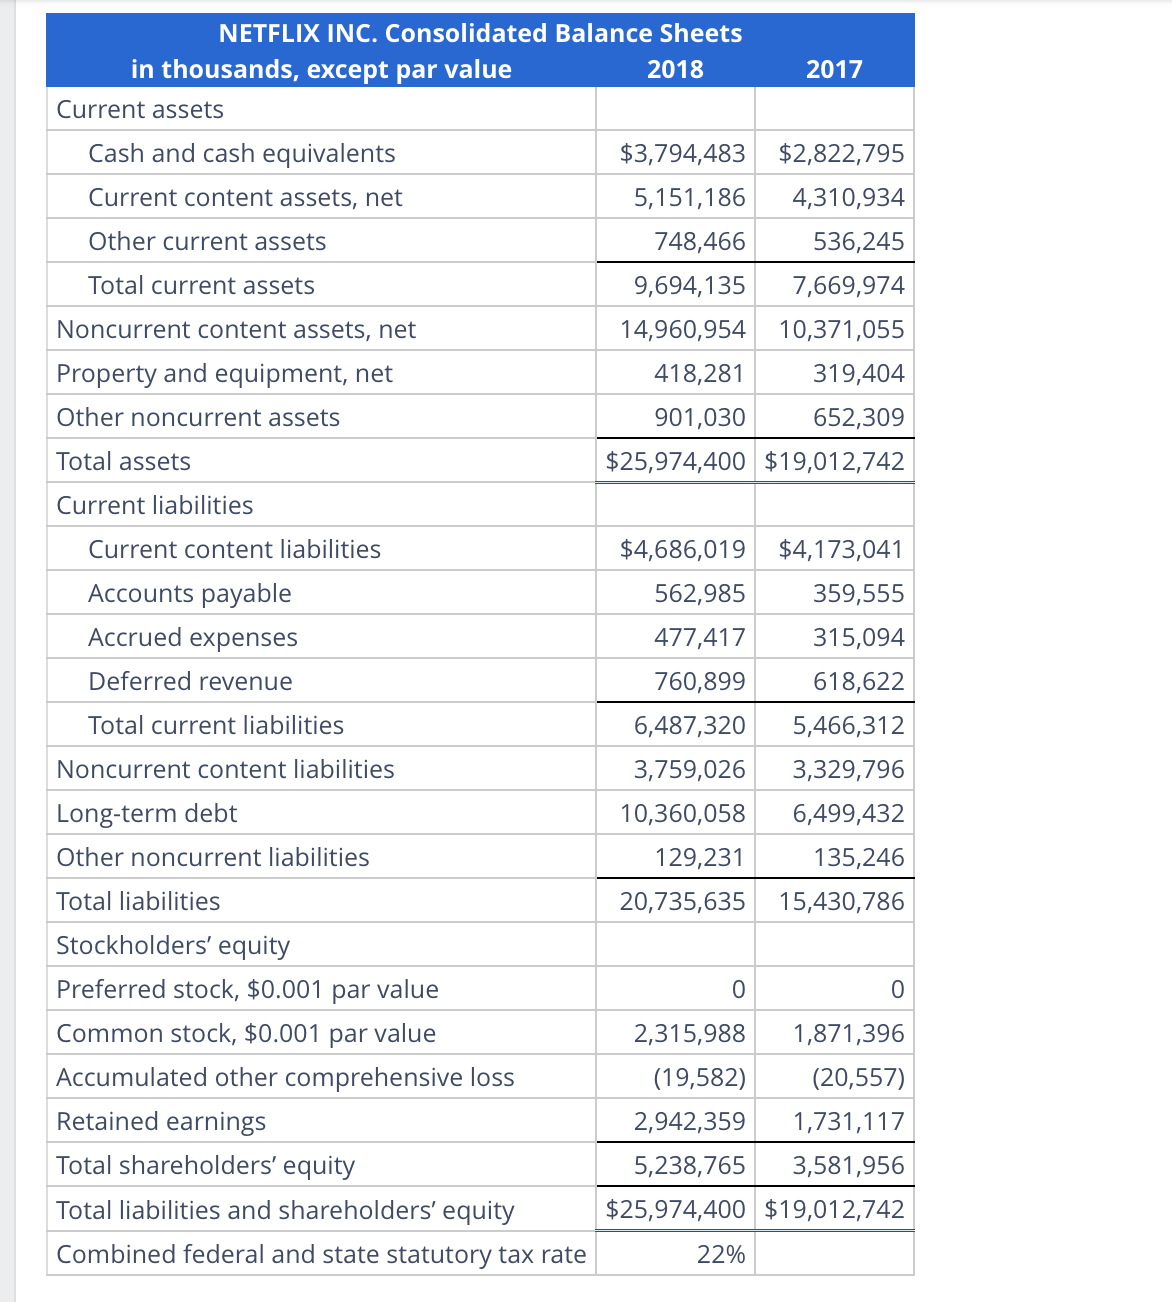
Question: Question - Incorrect Mark 0.00 out of Flag question Analysis and Interpretation of ROE and RNOA with No Noncontrolling Interest The 2018 balance sheets and
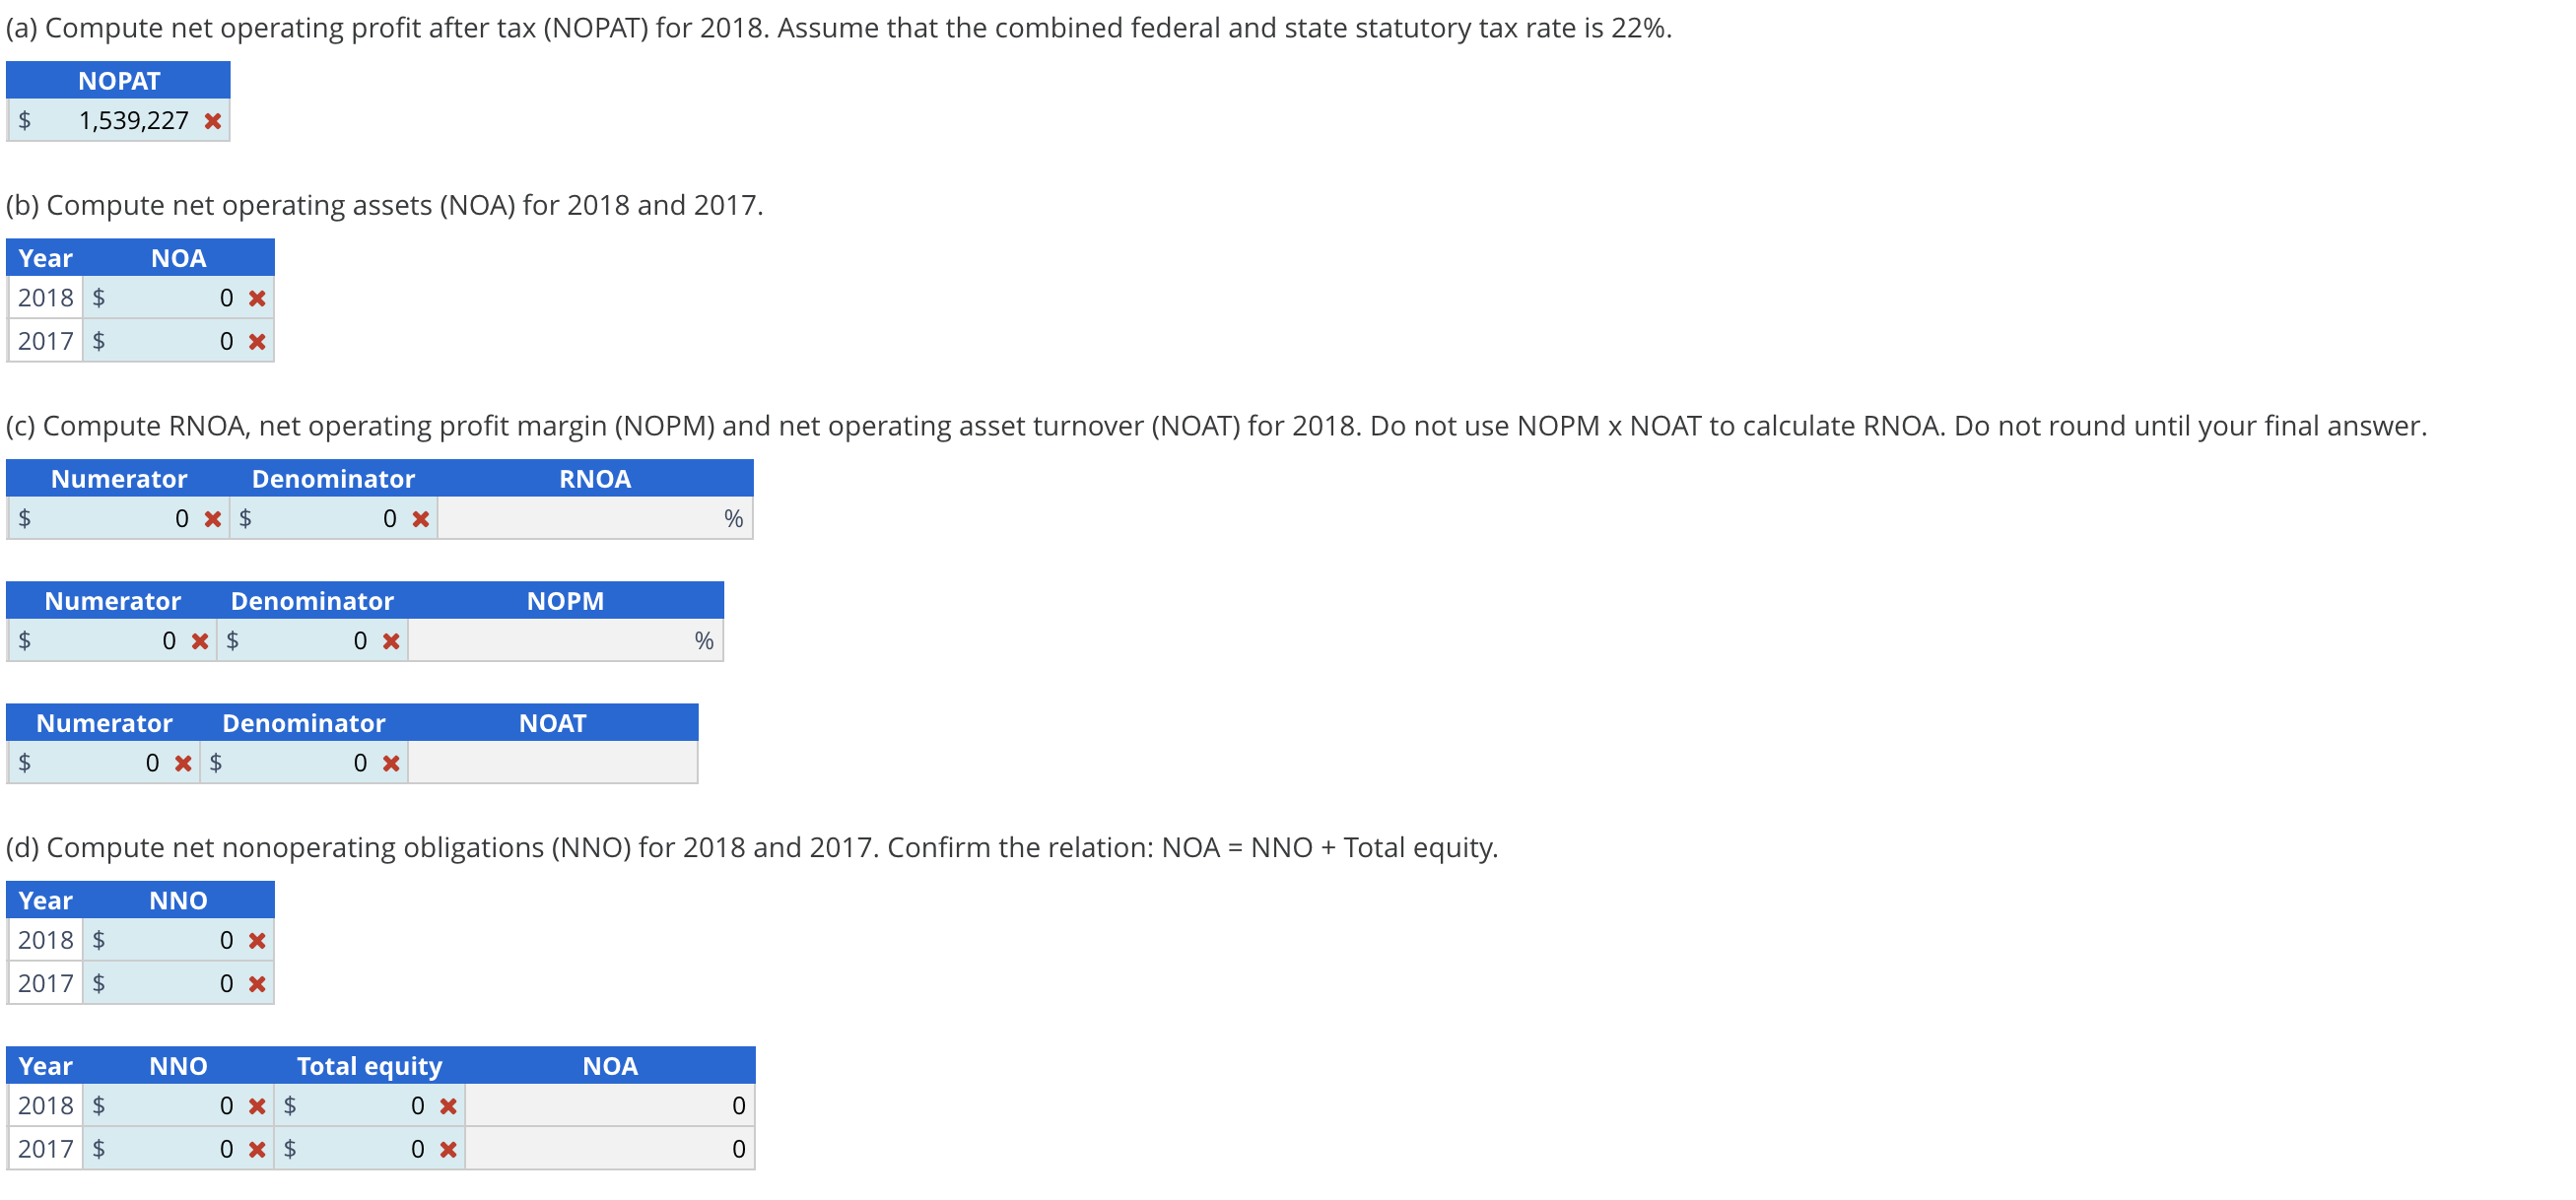
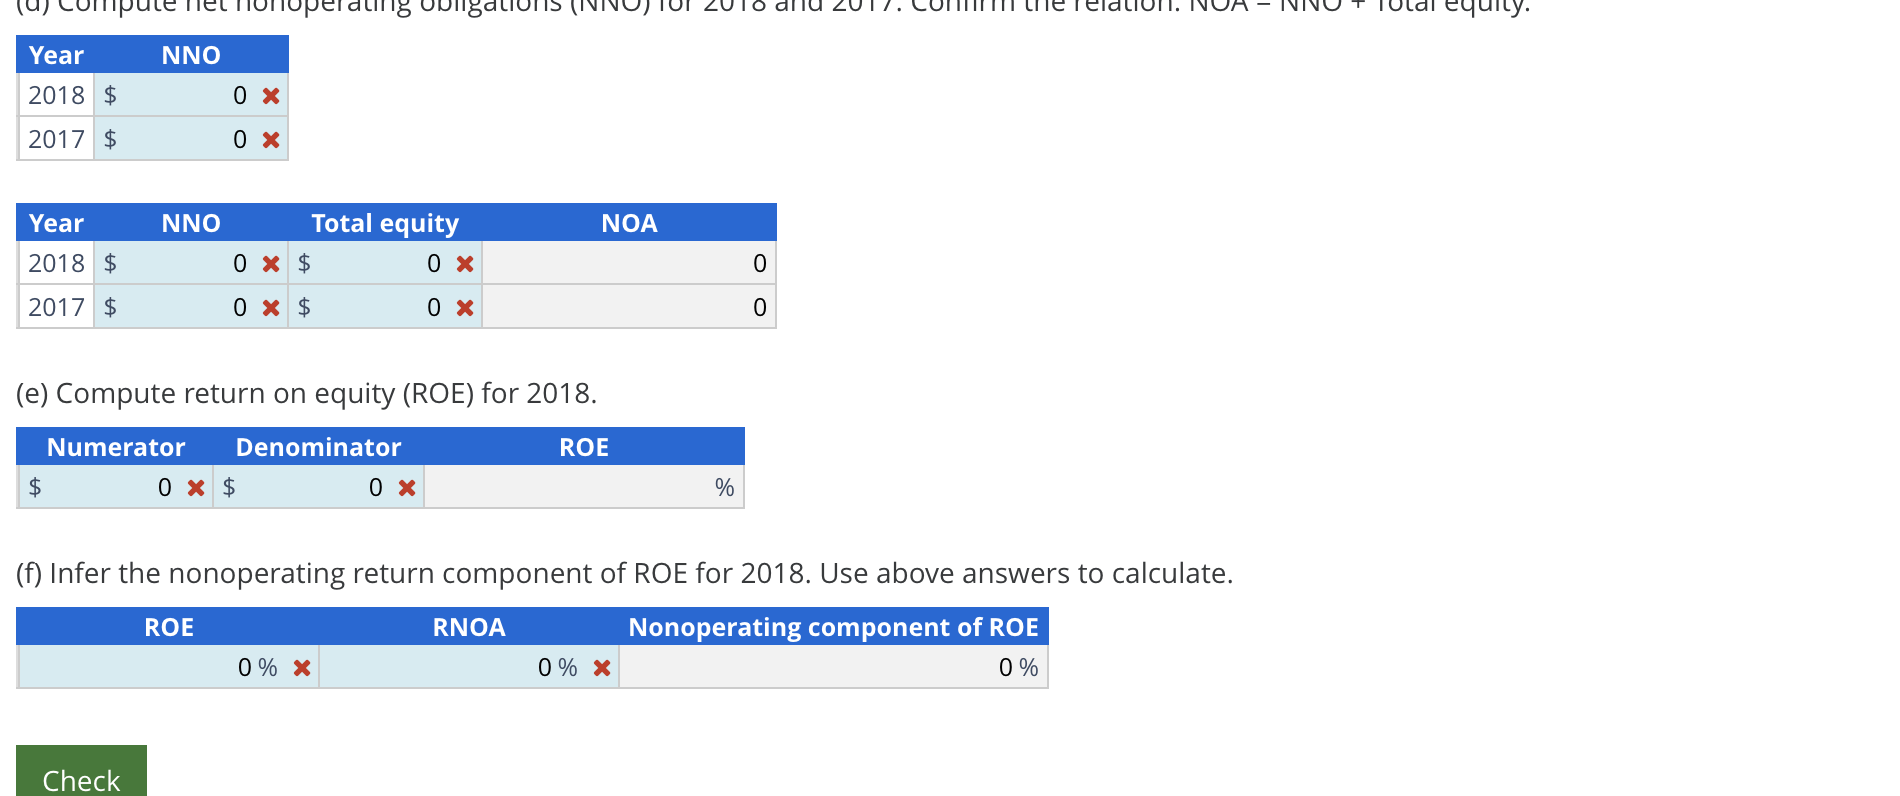
Question - Incorrect Mark 0.00 out of Flag question Analysis and Interpretation of ROE and RNOA with No Noncontrolling Interest The 2018 balance sheets and income statement for Netflix Inc. follow. Refer to these financial stat NETFLIX INC. Consolidated Statements of Earnings For Year Ended December 31, $ thousands 2018 Revenues $15,794,341 Cost of revenues 9,967,538 Marketing 2,369,469 Technology and development 1,221,814 General and administrative 630,294 Operating income 1,605,226 Other income (expense) Interest expense (420,493) Interest and other income 41,725 Income before income taxes 1,226,458 Provision for income taxes 15,216 Net income $1,211,242NETFLIX INC. Consolidated Balance Sheets in thousands, except par value Current assets Cash and cash equivalents Current content assets, net Other current assets Total current assets Noncurrent content assets, net Property and equipment, net Other noncurrent assets Total assets Current liabilities Current content liabilities Accounts payable Accrued expenses Deferred revenue Total current liabilities Noncurrent content liabilities Long-term debt Other noncurrent liabilities Total liabilities Stockholders' equity Preferred stock, $0.001 par value Common stock, $0.001 par value Accumulated other comprehensive loss Retained earnings Total shareholders' equity Total liabilities and shareholders' equity Combined federal and state statutory tax rate 2018 $3,794,483 5,151,186 748,466 9,694,135 14,960,954 418,281 901,030 iy $2,822,795 4,310,934 536,245 7,669,974 10,371,055 319,404 652,309 $25,974,400 | $19,012,742 $4,686,019 562,985 477,417 760,899 6,487,320 3,759,026 10,360,058 129,231 20,735,635 0 2,315,988 (19,582) 2,942,359 5,238,765 $4,173,041 359,555 315,094 618,622 5,466,312 3,329,796 6,499,432 135,246 15,430,786 0 1,871,396 (20,557) 1,731,117 3,581,956 $25,974,400 | $19,012,742 22% (a) Compute net operating profit after tax (NOPAT) for 2018. Assume that the combined federal and state statutory tax rate is 22%. NOPAT $ 1,539,227 x (b) Compute net operating assets (NOA) for 2018 and 2017. Year NOA 2018 $ O X 2017 $ O X (c) Compute RNOA, net operating profit margin (NOPM) and net operating asset turnover (NOAT) for 2018. Do not use NOPM x NOAT to calculate RNOA. Do not round until your final answer. Numerator Denominator RNOA $ Ox $ 0 X Numerator Denominator NOPM $ Ox $ 0 X % Numerator Denominator NOAT $ ox $ 0 X (d) Compute net nonoperating obligations (NNO) for 2018 and 2017. Confirm the relation: NOA = NNO + Total equity. Year NNO 2018 $ 0 X 2017 $ O X Year NNO Total equity NOA 2018 $ Ox $ O X C 2017 $ Ox $ O X 0(u ) Compute net onoperating Year NNO 2018 $ O X 2017 $ O X Year NNO Total equity NOA 2018 $ Ox $ O X O 2017 $ Ox $ O X 0 (e) Compute return on equity (ROE) for 2018. Numerator Denominator ROE Ox $ O X % (f) Infer the nonoperating return component of ROE for 2018. Use above answers to calculate. ROE RNOA Nonoperating component of ROE 0% X 0% X 0% Check
Step by Step Solution
There are 3 Steps involved in it
1 Expert Approved Answer
Step: 1 Unlock
Question Has Been Solved by an Expert!
Get step-by-step solutions from verified subject matter experts
Step: 2 Unlock
Step: 3 Unlock
Students Have Also Explored These Related Accounting Questions!