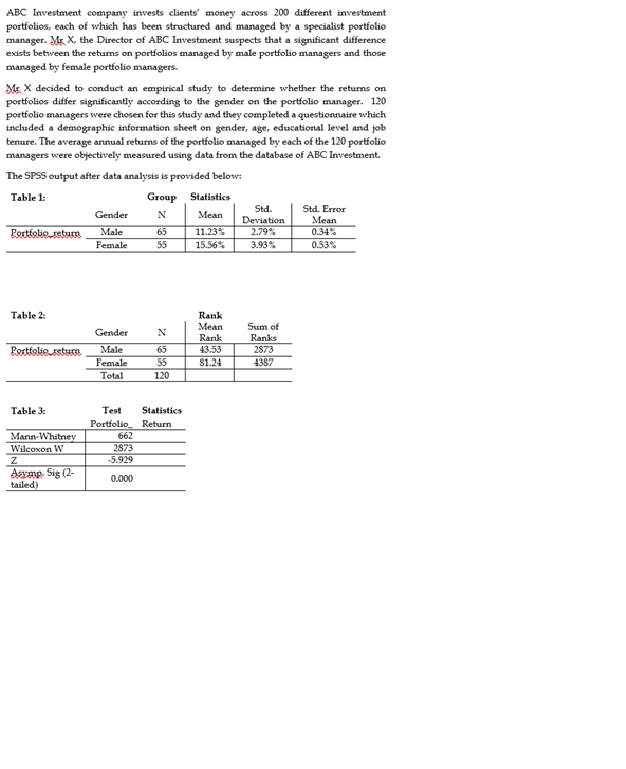
Question: Question: Interprete the output from Table 1 to 3 and explain them. ABC Investment company invests clients' money across 200 different investment portfolios, each of

Question: Interprete the output from Table 1 to 3 and explain them.

Question: Interprete the output from Table 1 to 3
ABC Investment company invests clients' money across 200 different investment portfolios, each of which has been structured and managed by a specialist portfolio manager. Mr. X, the Director of ABC Investment suspects that a significant difference exists between the returns on portfolios managed by male portfolio managers and those managed by female portfolio managers. Mr X decided to conduct an empirical study to determine whether the returns on portfolios differ significantly according to the gender on the portfolio manager. 120 portfolio managers were chosen for this study and they completed a questionnaire which included a demographic information sheet on gender, age, educational level and job tenure. The average annual returns of the portfolio managed by each of the 120 portfolio managers were objectively measured using data from the database of ABC Investment. The SPSS output after data analysis is provided below: Table 1: Group Statistics Gender N Mean Std. Std. Error Deviation Mean Male 65 11.23% 2.79% 0.34% Female $5 15.56% 3.93% 0.53% Table 2: Rank Gender N Mean Sum of Rank Ranks Portfolio return Male 65 43.53 2873 Female $5 81.24 4397 Total 120 Table J Test Statistics Portfolio Return Mann-Whitney 562 Wilcoxon W 2873 Z 5.929 Astamp Sig (2- tailed 0.00

Step by Step Solution

There are 3 Steps involved in it

1 Expert Approved Answer
Step: 1 Unlock blur-text-image
Question Has Been Solved by an Expert!

Get step-by-step solutions from verified subject matter experts

Step: 2 Unlock
Step: 3 Unlock

Students Have Also Explored These Related Finance Questions!