

Question: Question is below (3 separate parts). 22. In a statistics class at a university, students were asked how many hours of television they watch per
Question is below (3 separate parts).
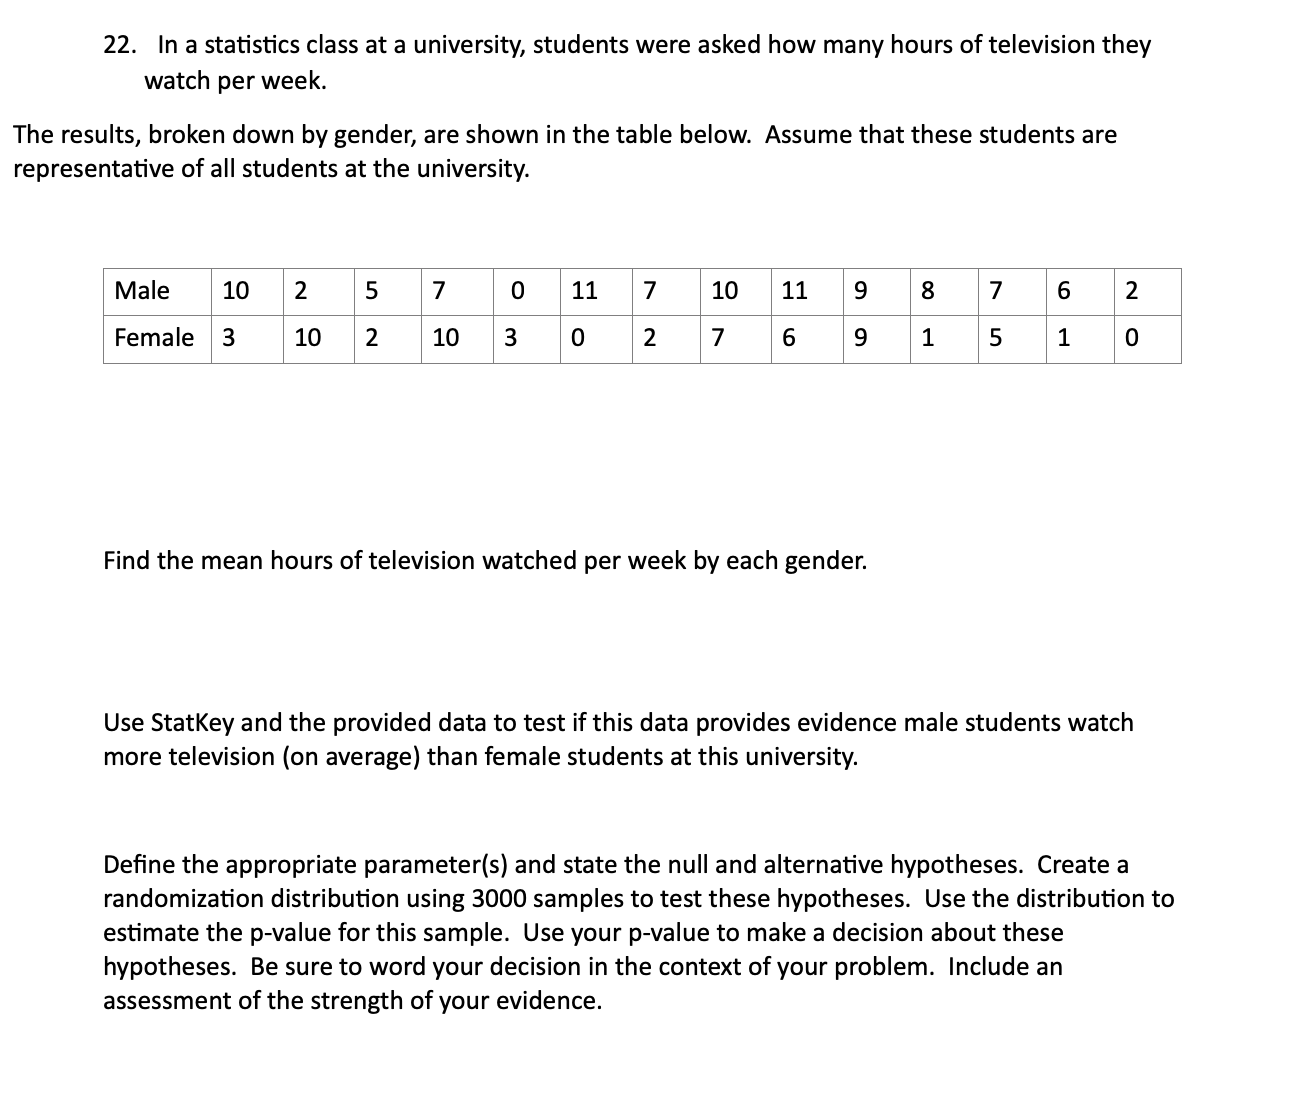
22. In a statistics class at a university, students were asked how many hours of television they watch per week. The results, broken down by gender, are shown in the table below. Assume that these students are representative of all students at the university. Male 10 2 5 7 0 11 7 10 11 9 8 7 6 2 Female 3 10 2 10 3 0 2 7 6 9 1 5 1 0 Find the mean hours of television watched per week by each gender. Use StatKey and the provided data to test if this data provides evidence male students watch more television (on average) than female students at this university. Dene the appropriate parameterls) and state the null and alternative hypotheses. Create a randomization distribution using 3000 samples to test these hypotheses. Use the distribution to estimate the p-value for this sample. Use your pvalue to make a decision about these hypotheses. Be sure to word your decision in the context of your problem. Include an assessment of the strength of your evidence
Step by Step Solution
There are 3 Steps involved in it

Get step-by-step solutions from verified subject matter experts