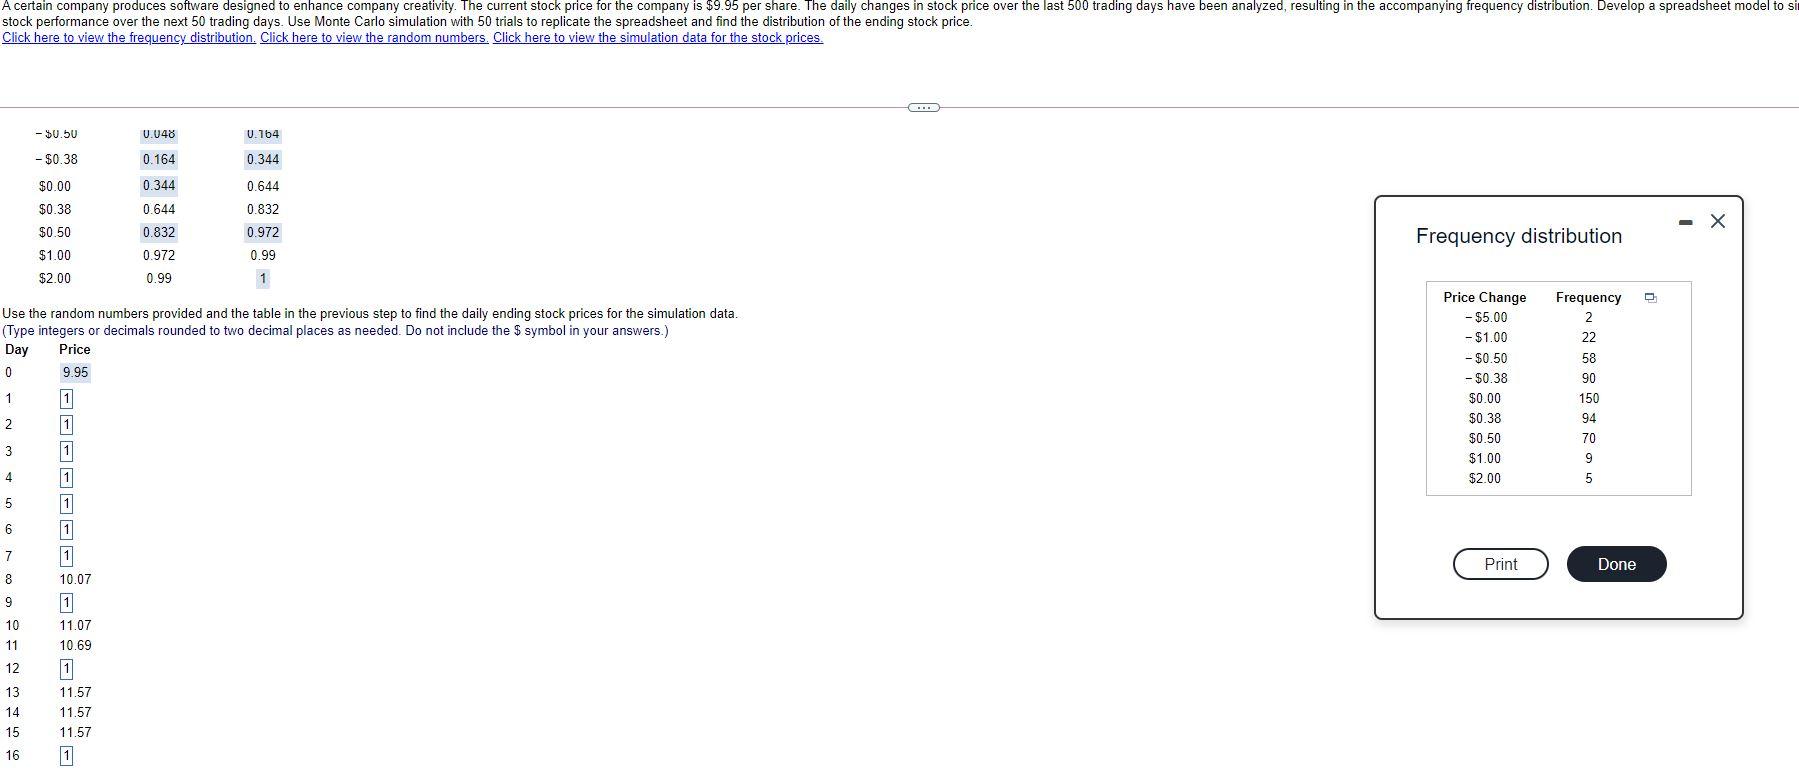
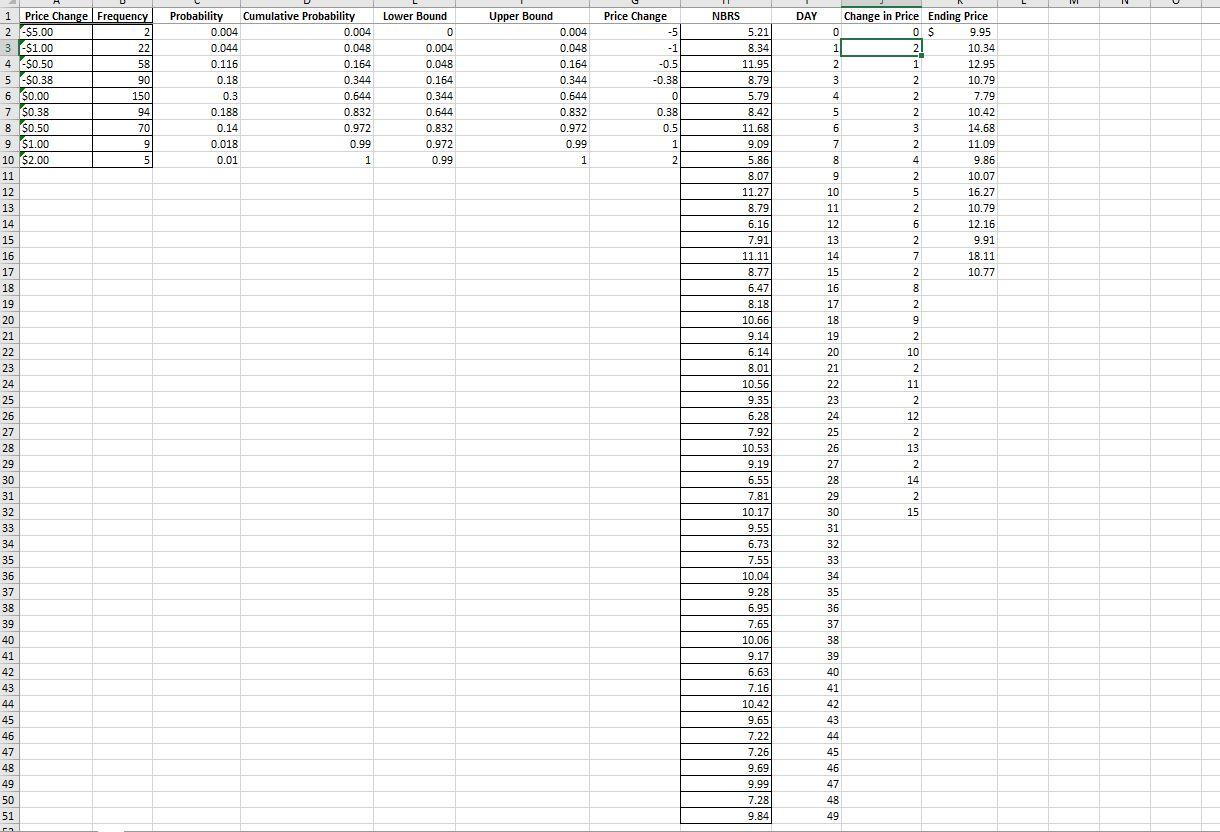
Question: Question is need to put in the correct Vlookup formula in order to find the answer of the daily changes in stock prices for simulation

Question is need to put in the correct Vlookup formula in order to find the answer of the daily changes in stock prices for simulation data. My numbers aren't adding up. This is for part B below.

Question is need to put in the correct VlookupQuestion is need to put in the correct Vlookup

A certain company produces software designed to enhance company creativity. The current stock price for the company is $9.95 per share. The daily changes in stock price over the last 500 trading days have been analyzed, resulting in the accompanying frequency distribution. Develop a spreadsheet model to si stock performance over the next 50 trading days. Use Monte Carlo simulation with 50 trials to replicate the spreadsheet and find the distribution of the ending stock price. Click here to view the frequency distribution. Click here to view the random numbers. Click here to view the simulation data for the stock prices. - $0.50 0.048 U.764 - $0.38 0.164 0.344 $0.00 0.344 0.644 - X $0.38 $0.50 $1.00 0.644 0.832 0.972 0.832 0.972 0.99 1 Frequency distribution $2.00 0.99 Use the random numbers provided and the table in the previous step to find the daily ending stock prices for the simulation data. (Type integers or decimals rounded to two decimal places as needed. Do not include the $ symbol in your answers.) Day Price 0 9.95 1 1 2 1 3 11 Price Change - $5.00 - $1.00 - $0.50 - $0.38 $0.00 $0.38 $0.50 $1.00 $2.00 Frequency 2. 22 58 90 150 94 70 9 5 4 1 5 1 6 6 1 1 Print Done 7 8 9 10 11 10.07 1 11.07 10.69 1 12 13 14 15 11.57 11.57 11.57 1 1 16 Lower Bound 0 Upper Bound DAY 3 -51.00 0.004 Probability Cumulative Probability 0.004 0.004 0.044 0.048 0.116 0.164 0.18 0.344 0.344 0.3 0. 0.644 0.832 0.14 0.972 0.018 0.99 0.01 1 0.004 0.048 0.164 0.344 0.644 0.644 0.832 0.972 0.99 1 0.048 0.164 0.344 0.644 0.832 0.972 0.99 Price Change -5 - 1 -0.5 -0.38 0 0.38 0.5 1 + 2 4 0.188 10 $2.00 1 1 Price Change Frequency 2 -$5.00 22 4 -$0.50 58 5 -$0.38 - 90 6 $0.00 150 00.00 7 $0.38 0 $ 94 8 $0.50 70 9 $1.00 9 5 10 11 -- 12 12 13 -- 14 14 15 13 16 16 17 1 18 18 19 20 20 21 2- 22 23 20 24 25 26 27 28 28 29 30 31 32 33 34 35 36 37 38 39 40 41 42 43 44 45 46 47 48 49 50 51 NBRS 5.21 8.34 11.95 8.79 5 5.79 8.42 11.68 11.00 9.09 5.86 8.07 11.27 11.21 8.79 0.14 6.16 7.31 7.91 11.11 11.11 8.77 0.11 0.7 6.47 0.10 8.18 10.66 10.00 9.14 2.14 6.14 0.14 0.01 8.01 10.30 10.56 9.35 2:22 6.28 0.20 7.92 10.53 9.19 6.55 702 7.81 10+ 10.17 9.55 6.73 7.55 10.04 9.28 or 6.95 21 7.65 10.06 . 9.17 6.63 7.16 10.42 9.65 e 7.22 7.26 9.69 9.99 7.28 9.84 Change in Price Ending Price 0 OS 9.95 1 2 10.34 2 1 12.95 3 2 10.79 - 4 2 7.79 - al 5 2 10.42 10.44 2 6 3 3 14.68 7 2 2 11.09 8 4 9.86 9 2 2 10.07 4 10.07 10 5 5 16.27 11 2 1 10.79 12 6 6 14 12.16 13 2 4 1 9.91 14 7 13 18.11 15 10.77 1 2 - 16 8 10 17 2 4 18 9 10 19 2 12 2 20 10 1 21 2 4 22 11 23 2 20 24 12 27 12 2 25 2 4 26 13 20 13 27 2 28 14 29 2 30 15 31 32 33 34 35 36 37 38 39 40 41 42 43 44 45 46 47 48 49

Step by Step Solution

There are 3 Steps involved in it

1 Expert Approved Answer
Step: 1 Unlock blur-text-image
Question Has Been Solved by an Expert!

Get step-by-step solutions from verified subject matter experts

Step: 2 Unlock
Step: 3 Unlock

Students Have Also Explored These Related General Management Questions!