

Question: Question is true or false. help Please indicate whether the following statements are true or false. 1. The standard deviation of a sampling distribution is
Question is true or false. help
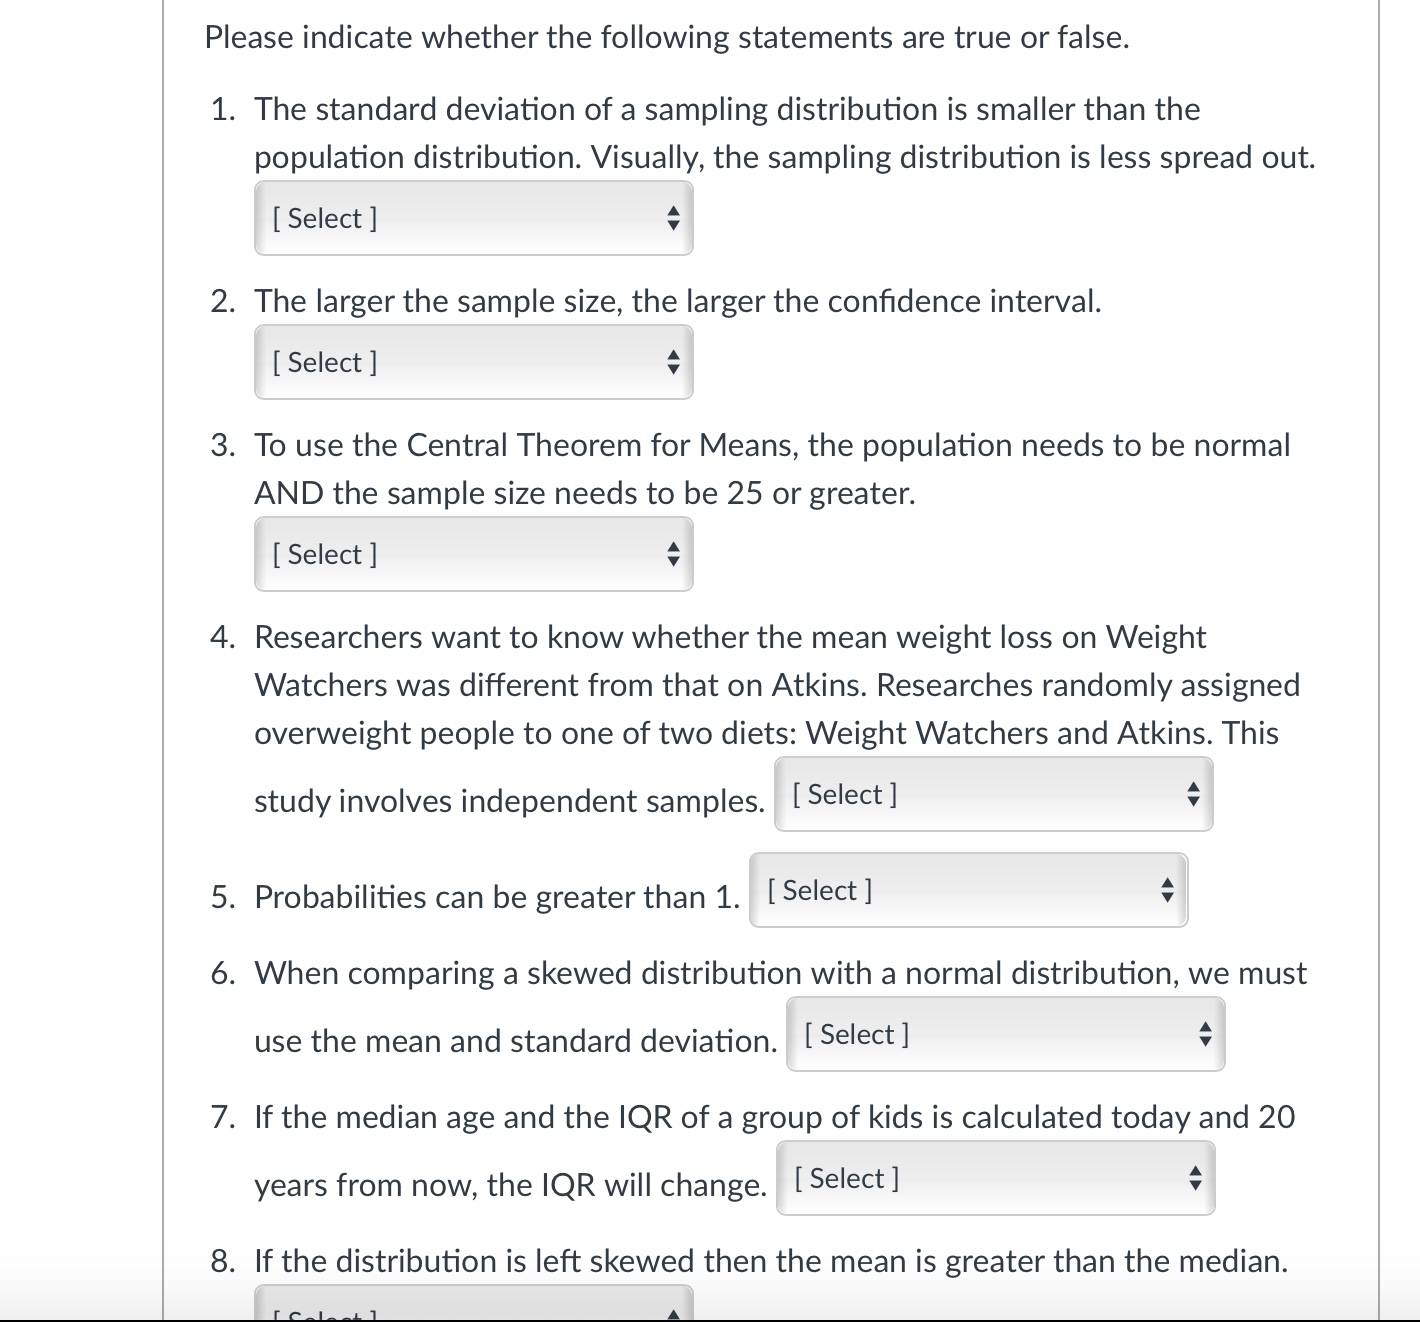
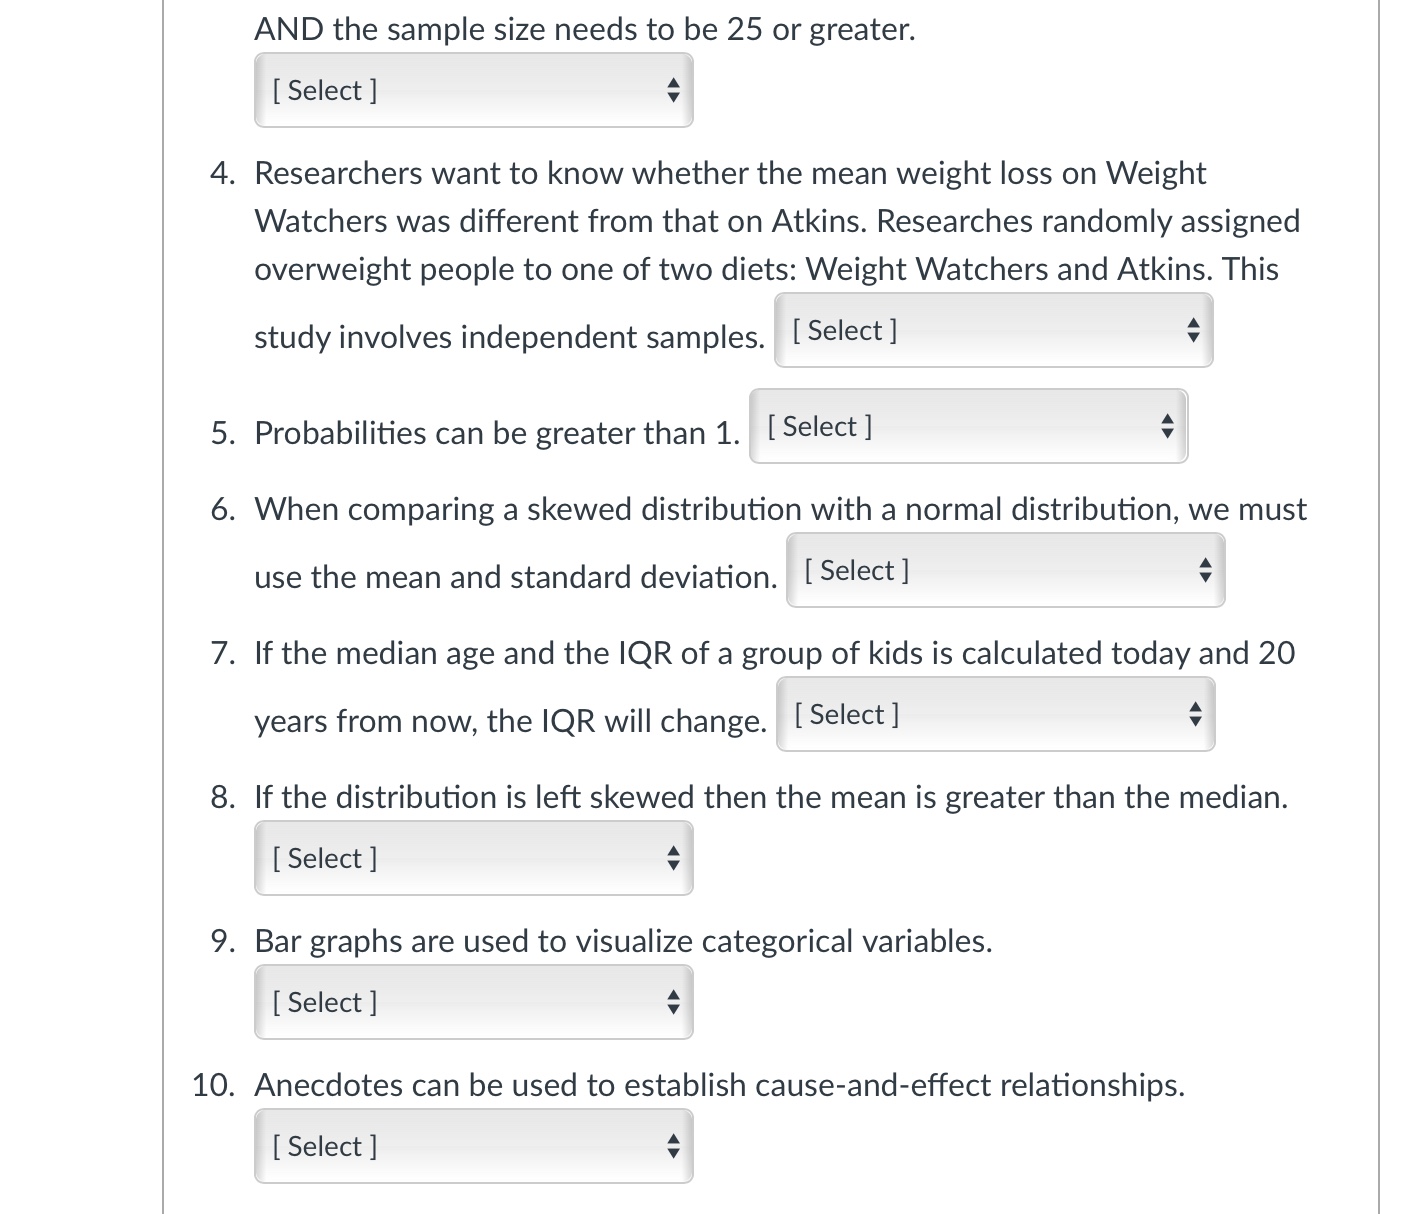
Please indicate whether the following statements are true or false. 1. The standard deviation of a sampling distribution is smaller than the population distribution. Visually, the sampling distribution is less spread out. [Select] 2. The larger the sample size, the larger the condence interval. [Select] 3. To use the Central Theorem for Means, the population needs to be normal AND the sample size needs to be 25 or greater. [Select] 4. Researchers want to know whether the mean weight loss on Weight Watchers was different from that on Atkins. Researches randomly assigned overweight people to one of two diets: Weight Watchers and Atkins. This study involves independent samples. [59'9\"] 4|? 5. Probabilities can be greater than 1. [Salad] 6. When comparing a skewed distribution with a normal distribution, we must A V use the mean and standard deviation. [53'3\"] 7. If the median age and the IQR of a group of kids is calculated today and 20 years from now, the IQR will change. [59'9\"] 3 8. If the distribution is left skewed then the mean is greater than the median. 8 9 10 AND the sample size needs to be 25 or greater. [Select] Researchers want to know whether the mean weight loss on Weight Watchers was different from that on Atkins. Researches randomly assigned overweight people to one of two diets: Weight Watchers and Atkins. This A V study involves independent samples. [SEleCt] 4| Probabilities can be greater than 1. [Salad] . When comparing a skewed distribution with a normal distribution, we must use the mean and standard deviation. [Select] If the median age and the IQR of a group of kids is calculated today and 20 years from now, the IQR will change. [59'9\"] If the distribution is left skewed then the mean is greater than the median. [Select] Bar graphs are used to visualize categorical variables. [Select] Anecdotes can be used to establish cause-and-effect relationships. [Select]
Step by Step Solution
There are 3 Steps involved in it

Get step-by-step solutions from verified subject matter experts