

Question: Question list 0 Question 1 0 Question 2 O Question 3 0 Question 4 l country from 1851 through 2015, where 1 is the weakest
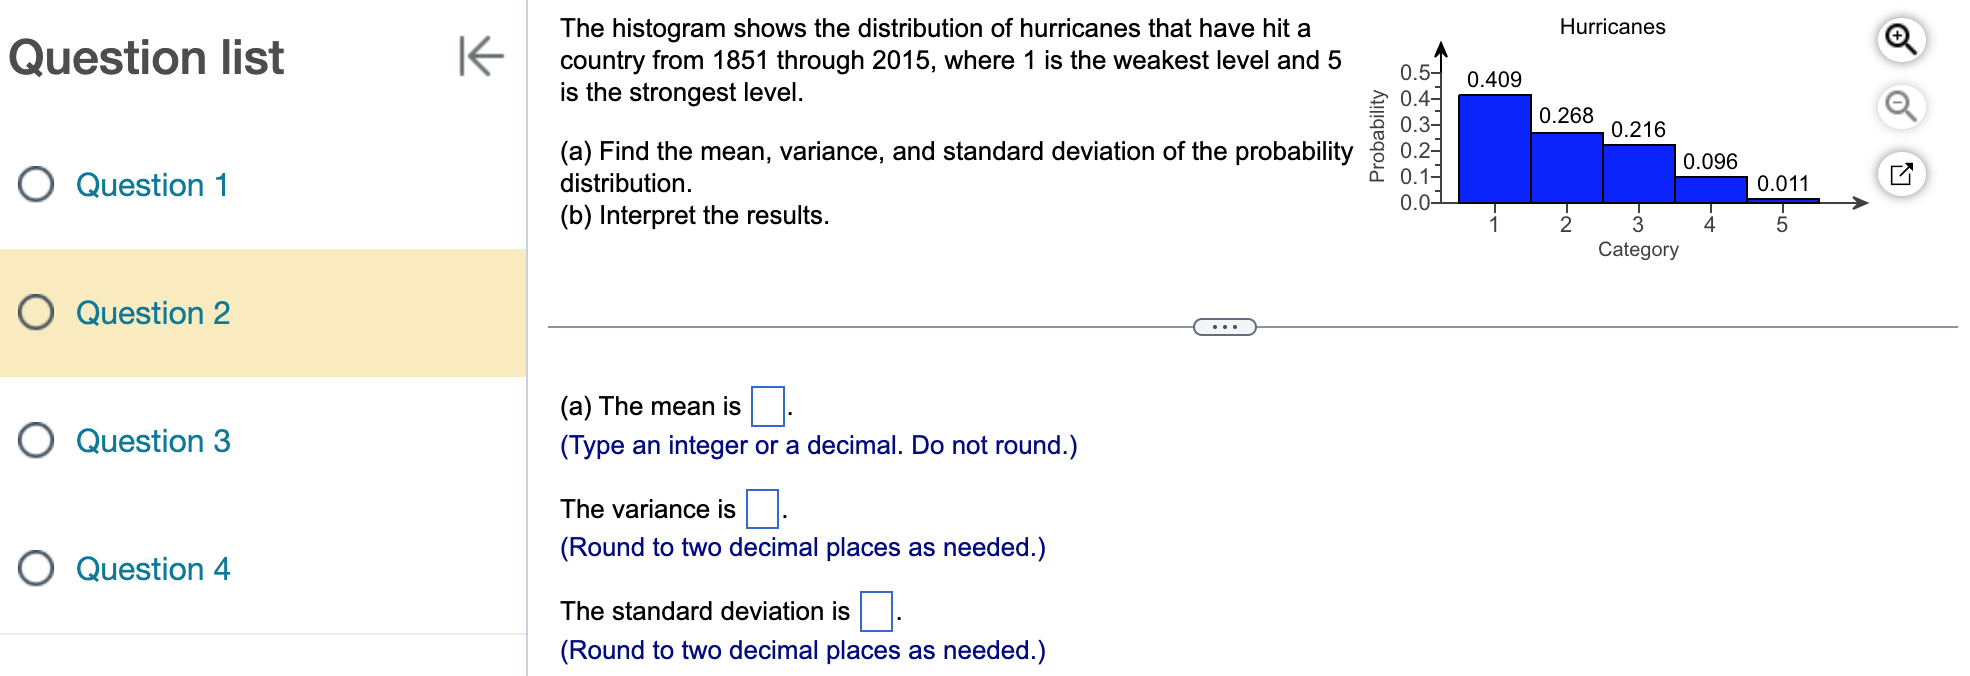


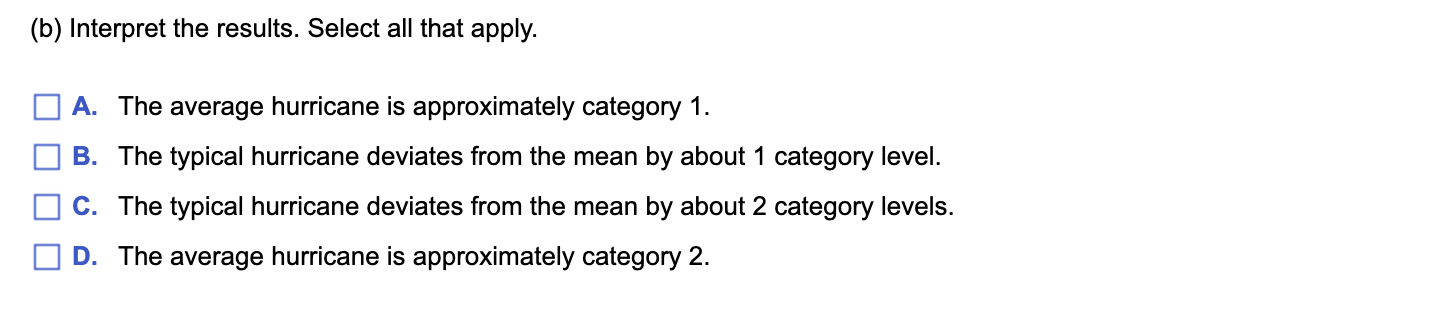
Question list 0 Question 1 0 Question 2 O Question 3 0 Question 4 l country from 1851 through 2015, where 1 is the weakest level and 5 The histogram shows the distribution of hurricanes that have hit a Hurricanes Q is the strongest level. Q Probability (a) Find the mean, variance, and standard deviation of the probability distribution. (b) Interpret the results. Category (a) The mean is (Type an integer or a decimal. Do not round.) The variance is :|. (Round to two decimal places as needed.) The standard deviation is :|. (Round to two decimal places as needed.) (b) Interpret the results. Select all that apply. |:| A. The average hurricane is approximately category 1. |:| B. The typical hurricane deviates from the mean by about 1 category level. |:| C. The typical hurricane deviates from the mean by about 2 category levels. |:| D. The average hurricane is approximately category 2
Step by Step Solution
There are 3 Steps involved in it

Get step-by-step solutions from verified subject matter experts