

Question: Question list Question 1 Question 2 0 Question 3 Question 4 Question 5 l6 An employment information service claims the mean annual salary for senior
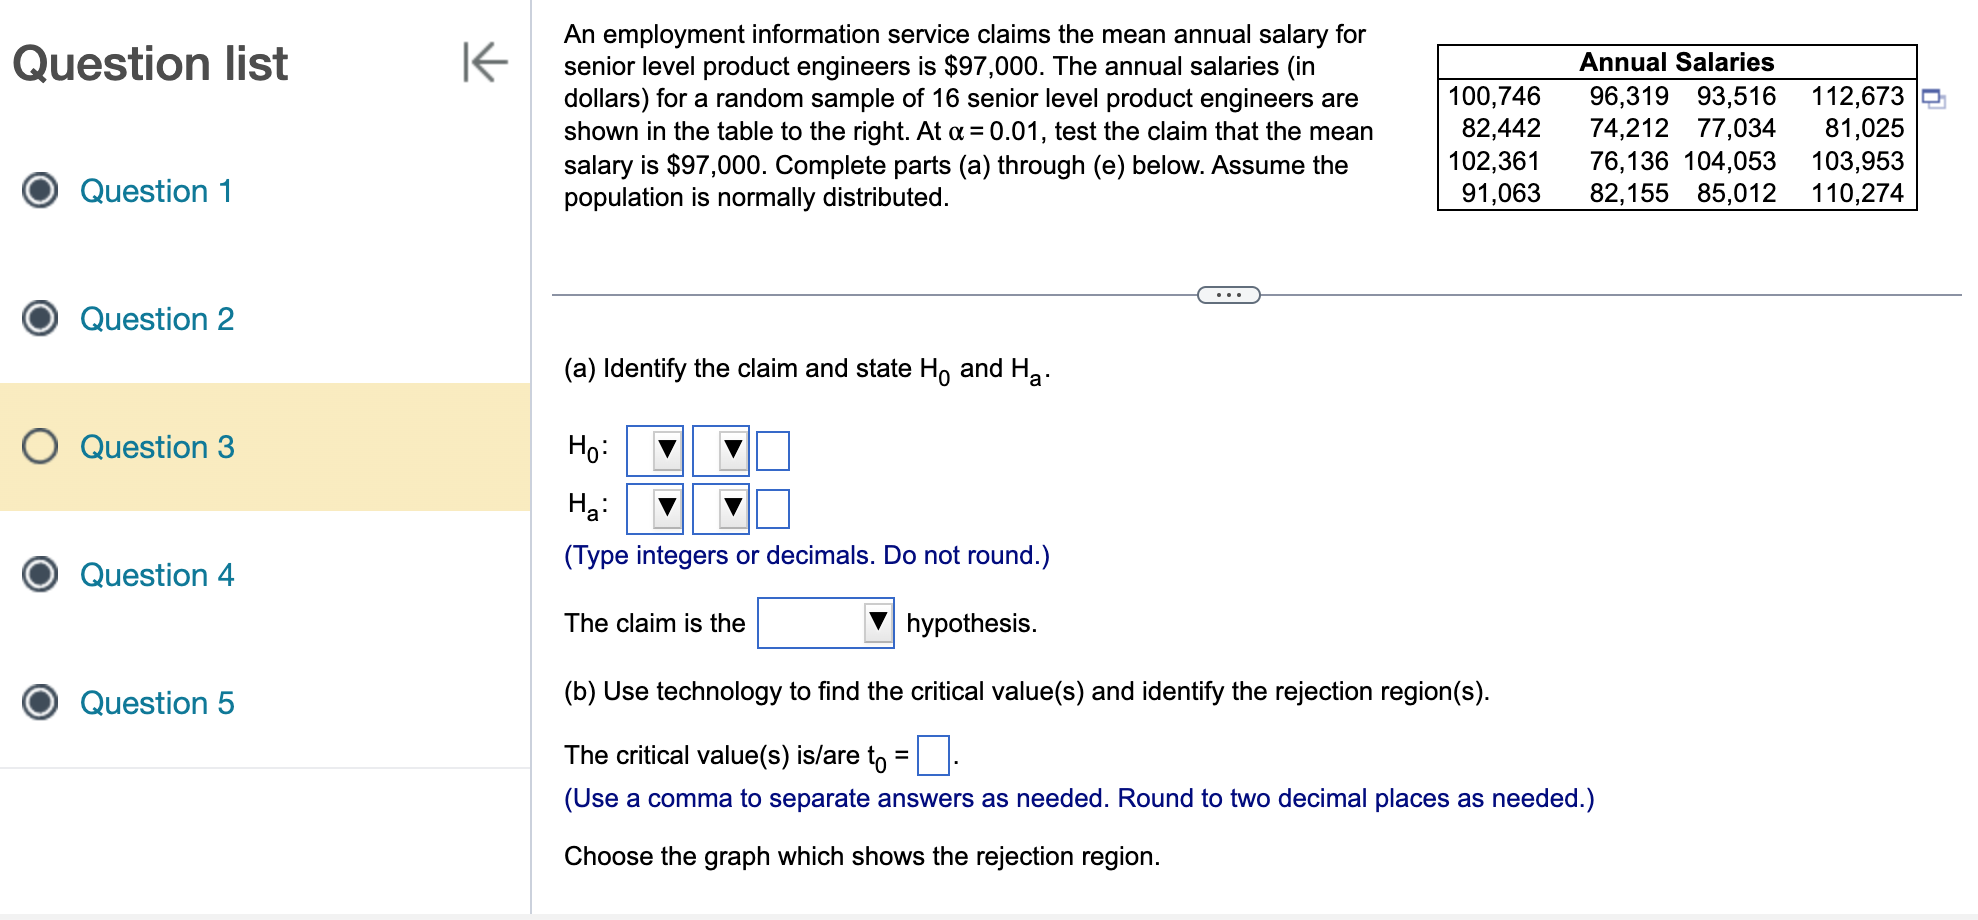


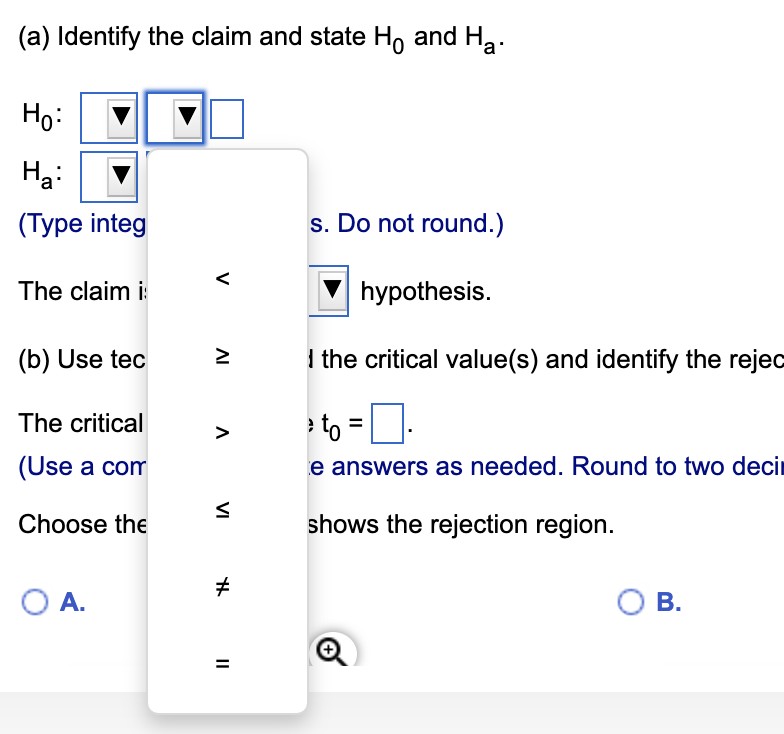
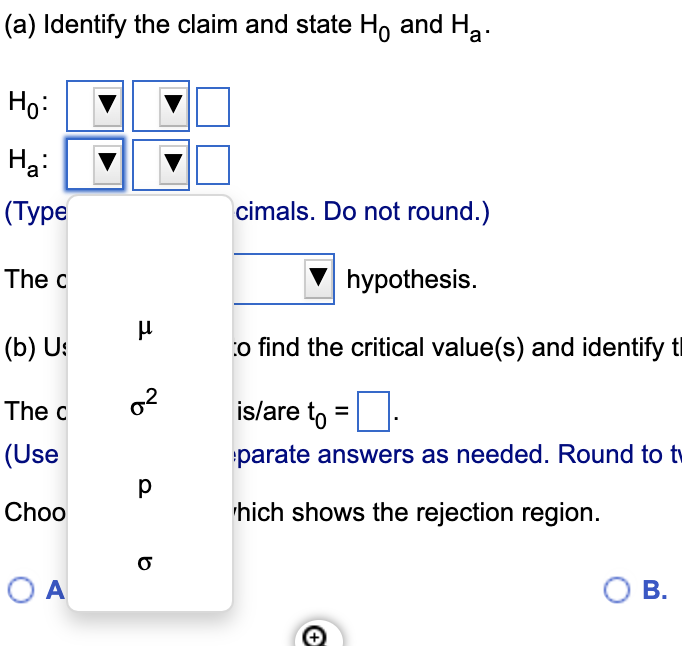


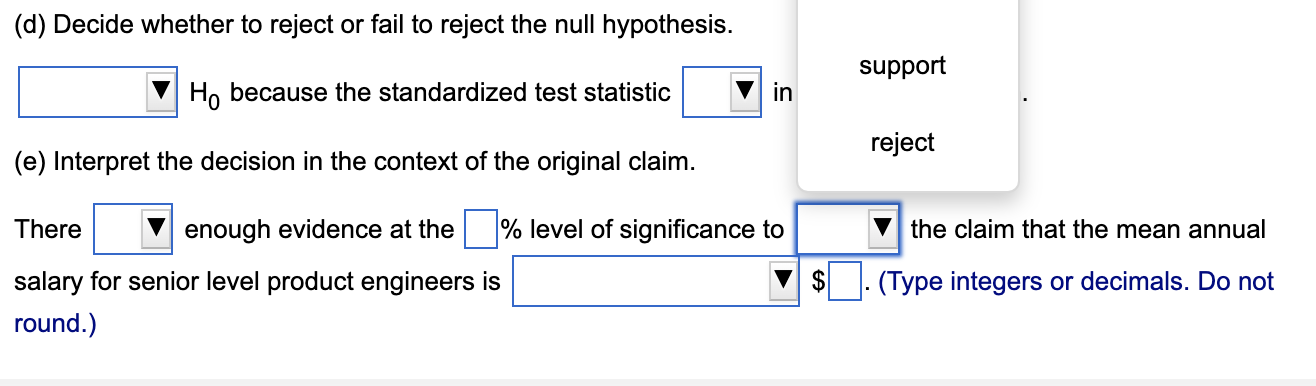
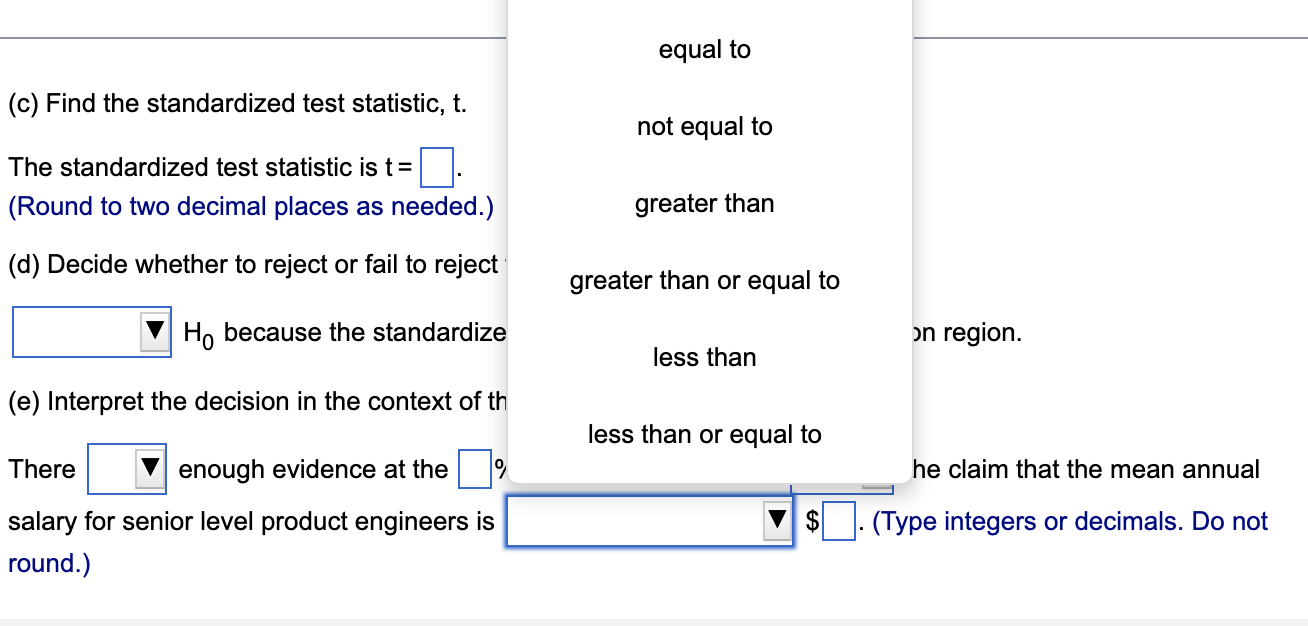

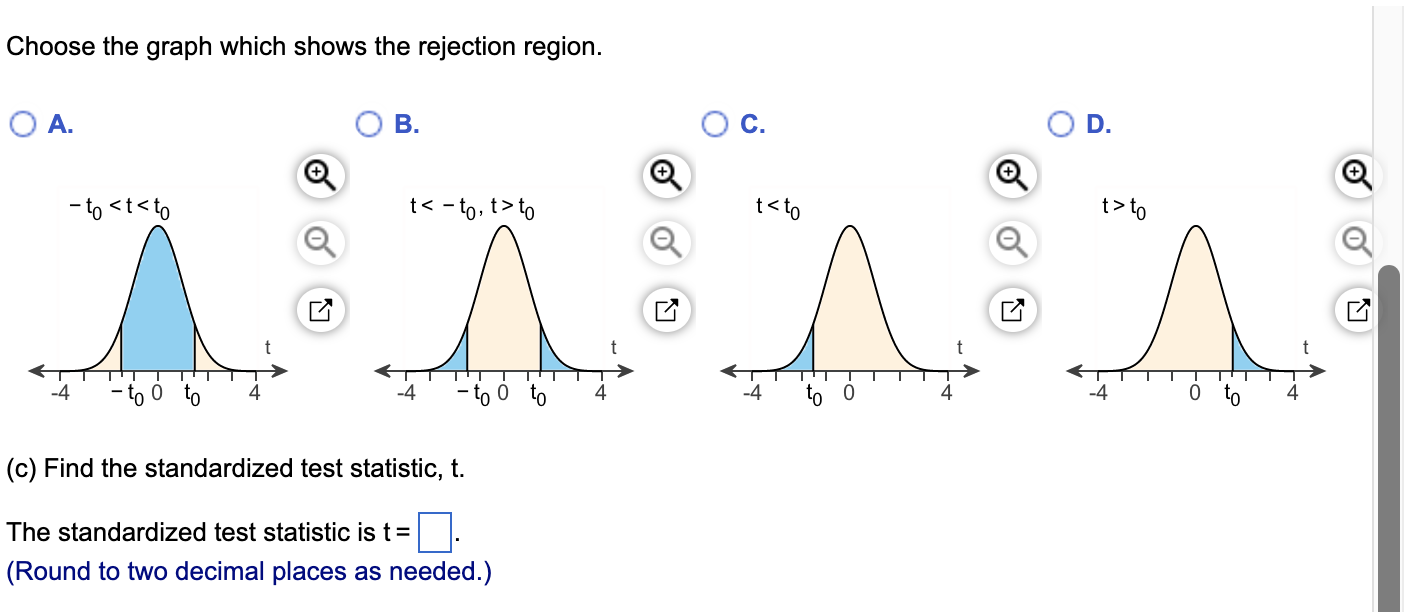
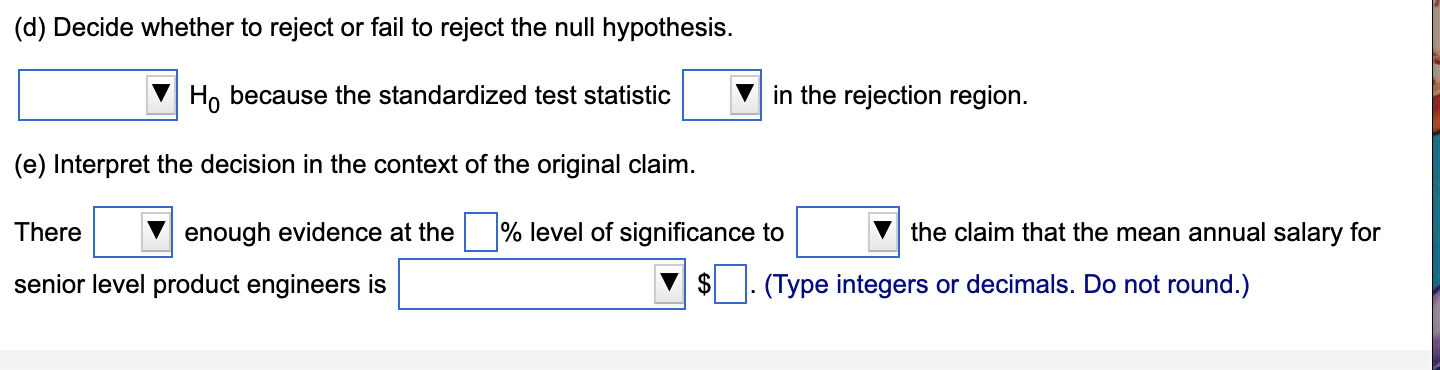


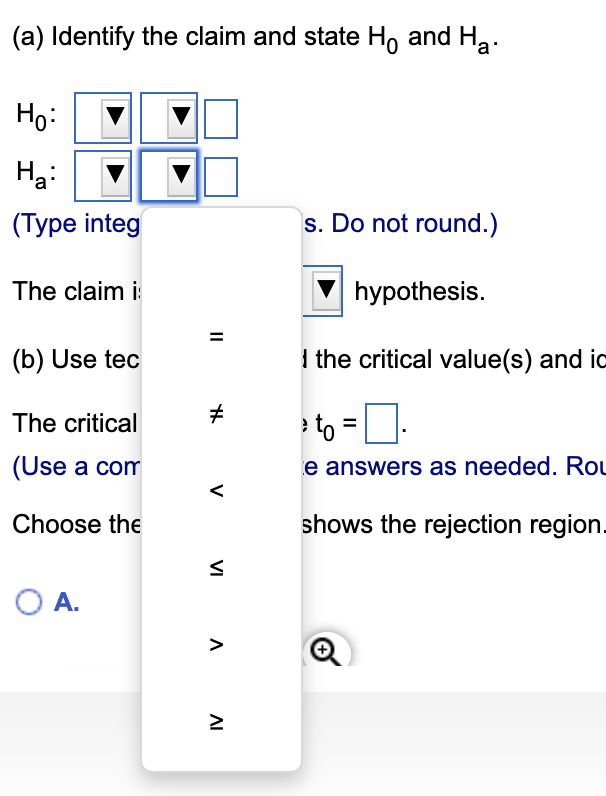

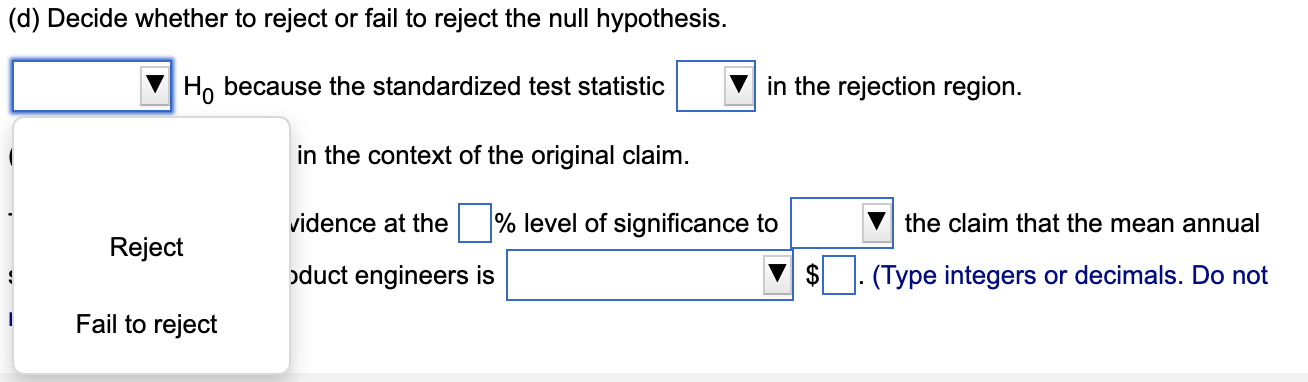

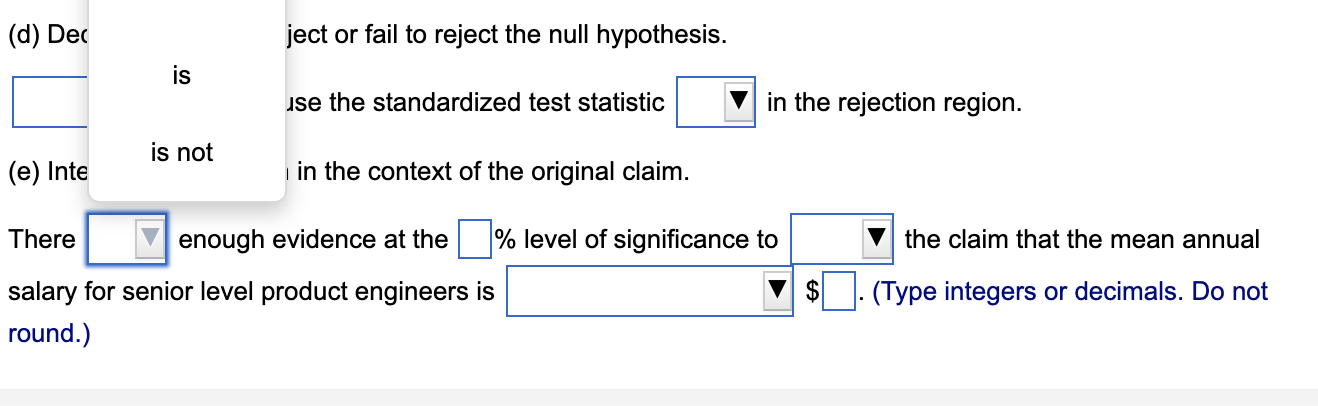


Question list Question 1 Question 2 0 Question 3 Question 4 Question 5 l6 An employment information service claims the mean annual salary for senior level product engineers is $97,000. The annual salaries (in Annual Salaries dollars) for a random sample of 16 senior level product engineers are 100,746 96,319 93,516 shown in the table to the right. At or = 0.01, test the claim that the mean 82,442 74,212 77.034 salary is $97,000. Complete parts (a) through (e) below. Assume the 102,361 76.136 104.053 population is normally distributed. 91,063 82,155 35.012 81,025 103,953 110,274 (3) Identify the claim and state H0 and Ha. Ho:| vl v|: Ha: v|_v|: (Type integers or decimals. Do not round.) The claim is the |:| hypothesis. (b) Use technology to nd the critical value(s) and identify the rejection region(s). The critical value(s) islare t0 = D. (Use a comma to separate answers as needed. Round to two decimal places as needed.) Choose the graph which shows the rejection region. Choose the graph which shows the rejection region. O A. OB. O C. OD. + + + - to
Step by Step Solution
There are 3 Steps involved in it

Get step-by-step solutions from verified subject matter experts