

Question: Question No: 05 Answer the following questions based on the data provided in the graph below. Assume that vertical lines drawn at quantities of 44
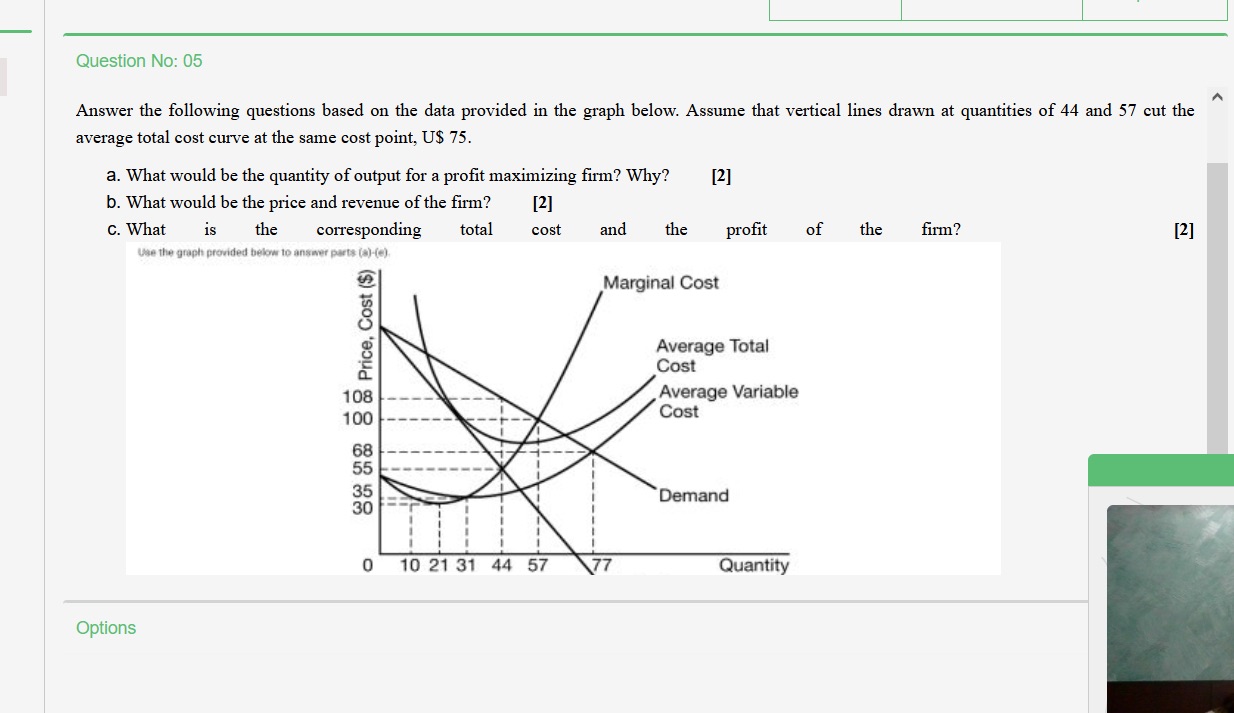
Question No: 05 Answer the following questions based on the data provided in the graph below. Assume that vertical lines drawn at quantities of 44 and 57 cut the average total cost curve at the same cost point, U$ 75. a. What would be the quantity of output for a profit maximizing firm? Why? [2] b. What would be the price and revenue of the firm? [2] C. What is the corresponding total cost and the profit of the firm? [2] Use the graph provided below to answer parts ()() Marginal Cost & Price, Cost ($) Average Total Cost Average Variable 100 Cost 68 55 35 Demand 30 0 10 21 31 44 57 Quantity Options
Step by Step Solution
There are 3 Steps involved in it
1 Expert Approved Answer
Step: 1 Unlock

Question Has Been Solved by an Expert!
Get step-by-step solutions from verified subject matter experts
Step: 2 Unlock
Step: 3 Unlock