

Question: Question No: 05 This is a subjective question, hence you have to write your answer in the Text-Fleld given below. XYZ company takes customer satisfaction
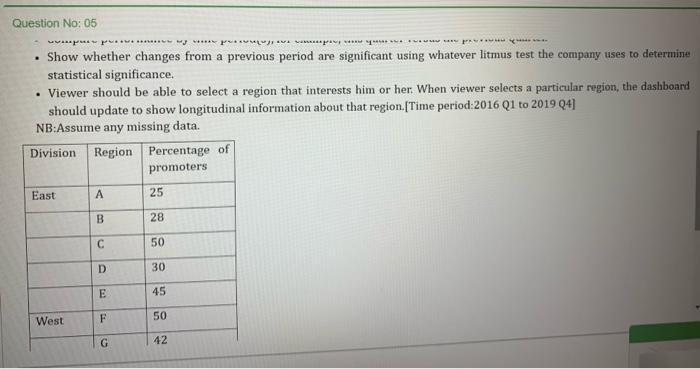
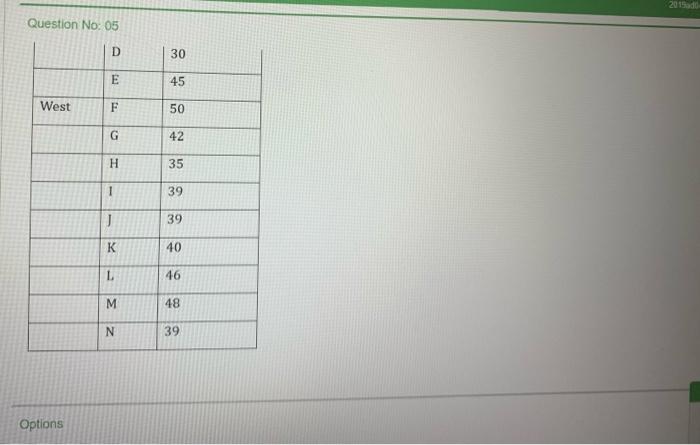
Question No: 05 This is a subjective question, hence you have to write your answer in the Text-Fleld given below. XYZ company takes customer satisfaction very seriously. You monitor it on a monthly basis by major geographic areas (divisions) and subareas (regions) and need to see in which areas it's increasing, decreasing, or staying the same. You want to be able to react to downturns quickly, but you don't want to panic unnecessarily so you need to see if changes from the previous time period are statistically significant. You also need to be able to look at changes over time to see if big swings are isolated to the particular period or indicative of a larger problem 15*2#OM] Design a dashboard using the specifics and following the concepts learned in the course. Specifics Show the percentage of customers who are very satisfied with your products and services ("Promoters"), broken down by division and region. Sort the data by region so it's easy to see in which divisions customers are most satisfied and in which they are least satisfied. Compare performance by time period(s), for example, this quarter versus the previous Quarter. Show whether changes from a previous period are significant using whatever litmus test the company uses to determine statistical significance. Viewer should be able to select a region that interests him or her. When viewer selects a particular region, the dashboard . . 141 Question No: 05 .............PLEVELSE........ . Show whether changes from a previous period are significant using whatever litmus test the company uses to determine statistical significance. Viewer should be able to select a region that interests him or her. When viewer selects a particular region, the dashboard should update to show longitudinal information about that region. [Time period:2016 Q1 to 201904) NB:Assume any missing data. Division Region Percentage of promoters East A 25 B 28 50 D 30 E 45 West F 50 G 42 2015 de Question No: 05 D 30 E 45 West F 50 42 35 1 39 J 39 K 40 L 46 M 48 N 39 Options
Step by Step Solution
There are 3 Steps involved in it

Get step-by-step solutions from verified subject matter experts