

Question: Question no. 2: Question #3) You were provided with the following data of COVID-19 positive patients. Age (X) 84 80 77 97 59 W Weight
Question no. 2:
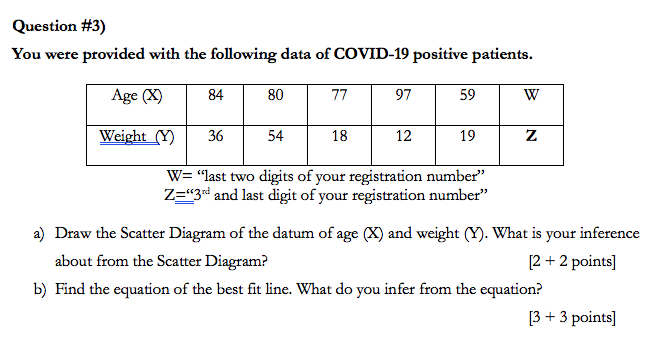
Question #3) You were provided with the following data of COVID-19 positive patients. Age (X) 84 80 77 97 59 W Weight (Y) 36 54 18 12 19 Z W= "last two digits of your registration number" Z="3" and last digit of your registration number" a) Draw the Scatter Diagram of the datum of age (X) and weight (Y). What is your inference about from the Scatter Diagram? [2 + 2 points] b) Find the equation of the best fit line. What do you infer from the equation? [3 + 3 points]
Step by Step Solution
There are 3 Steps involved in it
To solve this question Ill guide you through both parts a and b a Draw the Scatter Diagram and Infer... View full answer

Get step-by-step solutions from verified subject matter experts