

Question: Question number 1 (a). You intend to collect data using the following five (5) questions and possible responses. Each question constitutes a variable. Q1.
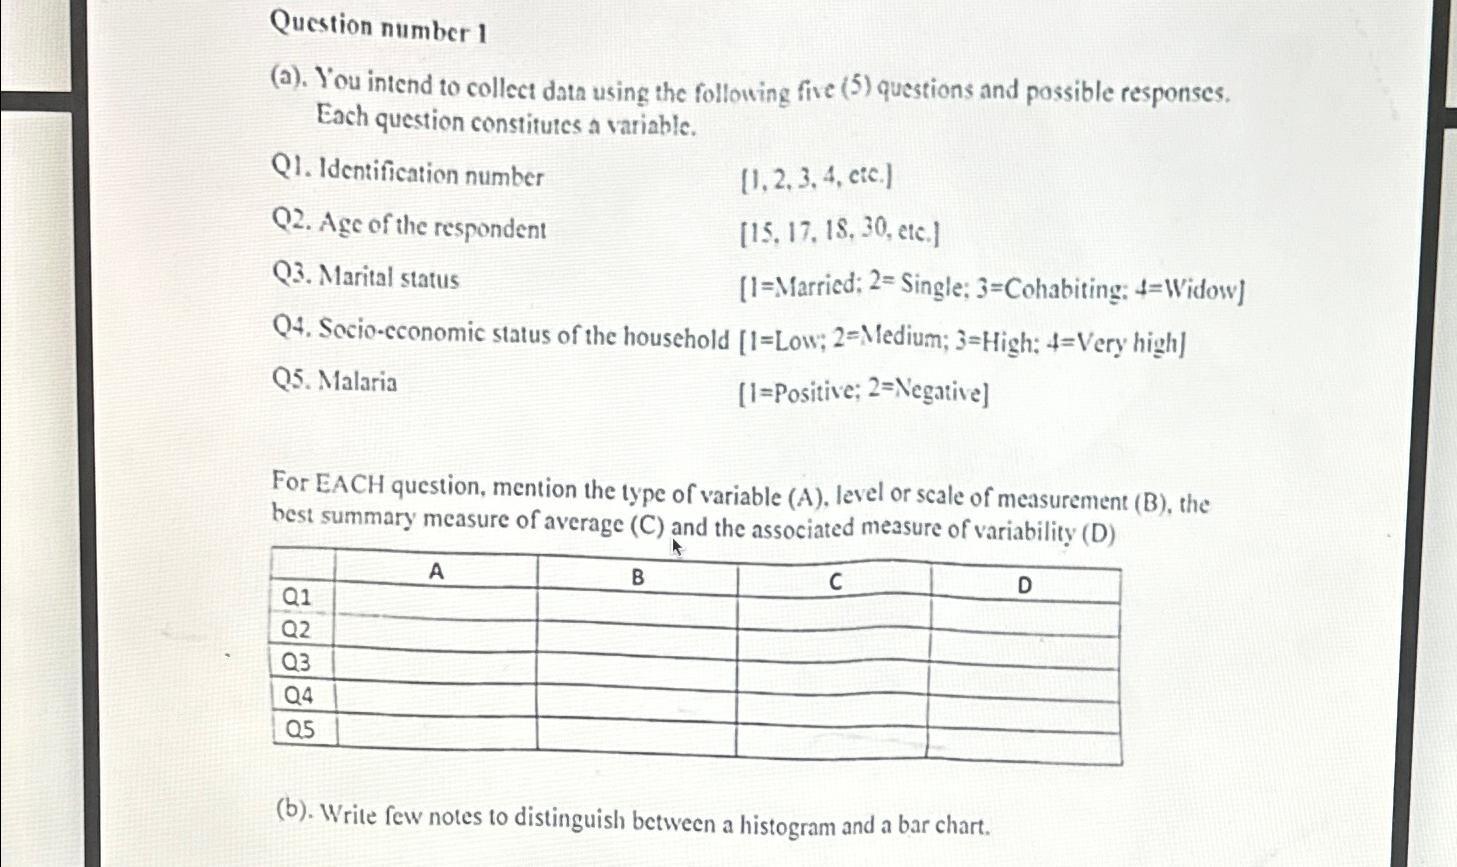
Question number 1 (a). You intend to collect data using the following five (5) questions and possible responses. Each question constitutes a variable. Q1. Identification number Q2. Age of the respondent Q3. Marital status [1, 2, 3, 4, etc.] [15, 17, 18, 30, etc.] [1=Married; 2= Single; 3-Cohabiting: 4-Widow] Q4. Socio-economic status of the household [1-Low; 2=Medium; 3-High; 4-Very high] Q5. Malaria [1=Positive; 2=Negative] For EACH question, mention the type of variable (A), level or scale of measurement (B), the best summary measure of average (C) and the associated measure of variability (D) Q1 Q2 Q3 Q4 Q5 A B C (b). Write few notes to distinguish between a histogram and a bar chart. D
Step by Step Solution
There are 3 Steps involved in it

Get step-by-step solutions from verified subject matter experts